What MyGenerali actually does (from store listing)
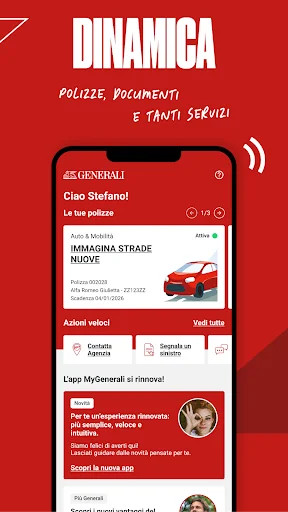
The new MyGenerali app, completely redesigned in terms of visuals and user experience, is designed to meet the needs of Generali Italia customers in terms of transparency, service, and multi-channel capabilities.
The main new features:
- Rich content: all information on insurance products at a glance—funds, returns, active guarantees, and editorial initiatives—in a clear channel accessible even to those using assistive technology.
- Integrated and useful services: access to services included …
The new MyGenerali app, completely redesigned in terms of visuals and user experience, is designed to meet the needs of Generali Italia customers in terms of transparency, service, and multi-channel capabilities.
The main new features:
- Rich content: all information on insurance products at a glance—funds, returns, active guarantees, and editorial initiatives—in a clear channel accessible even to those using assistive technology.
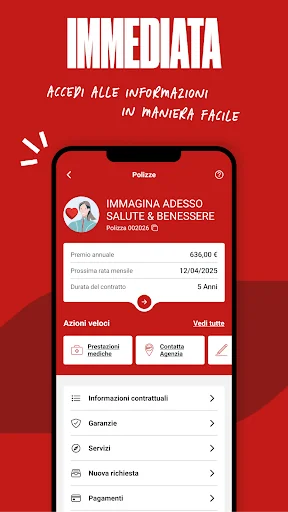
- Integrated and useful services: access to services included in purchased products, sending requests to the agency from your smartphone, and convenient bookings in the Health section.
- Direct interaction with our Consultants: agency contacts and requests always at your fingertips, maintaining a central relationship even in the digital experience.
What you'll find in the app:
- Secure, easy, and fast registration;
- The ability to view and manage your policies and update your personal data;
- Information such as risk certificates, account statements, details of insurance coverage, and status of premiums paid or outstanding;
- Access to assistance wherever you are;
- Claim reporting and progress monitoring;
- Interactive map of participating centers
- Updates on Più Generali loyalty club benefits and partner discounts;
- Details on driving style and advanced features for vehicles with satellite devices;
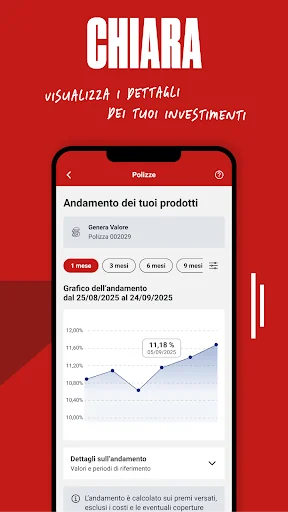
- Investment trends and insured capital for life insurance policies;
- And much more.
ACCESSIBILITY INFORMATION
https://www.generali.it/accessibilita
Generali Italia S.p.A.
Registered Office: Mogliano Veneto (TV), Via Marocchesa, 14, CAP 31021
Comparable Android apps
The five apps in Finance with the closest revenue to MyGenerali. Click any to see its detail page.
Each forecast combines App Store rating, ratings count, monetisation model, pricing tier, IAP signals and ad-supported flag.
The base estimate is then multiplied by a per-category scaling factor learned from apps with founder-verified MRR.
Every number on this page comes from public APIs and bumetric's own snapshot history.
Full methodology covers input variables, accuracy bands per category and how we treat apps without comparable anchors.
See also the live data on MyGenerali's tracker page for current rating, reviews and snapshot timeline.
Building something similar? Get a free AI audit with $-revenue forecasts for every recommendation.


 Betterment Invest & Save Money
 BilletesMx
 Bangor Mobile
 Addiko Mobile Hrvatska
 SB톡톡플러스