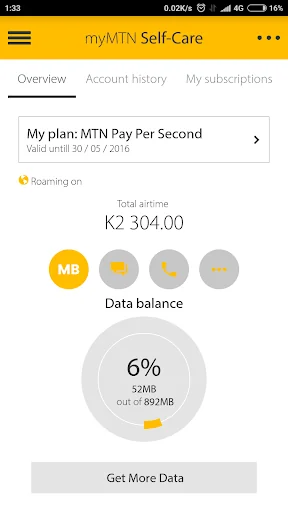
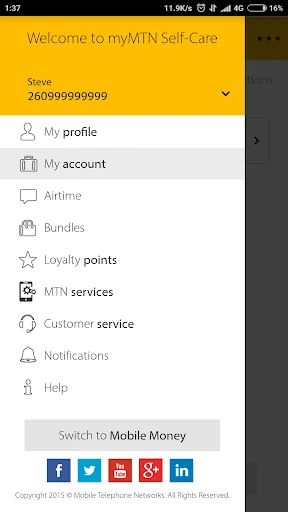
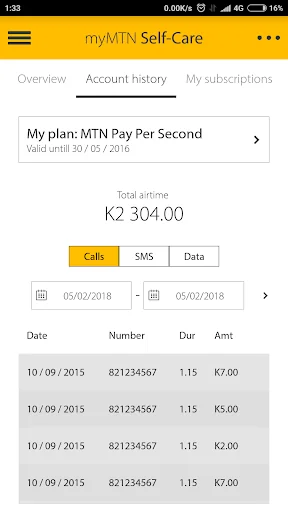
Welcome to the world of services to suit everyone’s needs. With MyMTN you can topup airtime, purchase bundles pay your bills and much more.
It’s everything you need, all in one place. Manage your mobile world the easy way with MyMTN.
MyMTN gives subscribers greater control of their own mobile services so that they can access services and solve issues without having to contact company representatives. MyMTN also ensures customers have access to information about MTN’s products and services when…
Welcome to the world of services to suit everyone’s needs. With MyMTN you can topup airtime, purchase bundles pay your bills and much more.
It’s everything you need, all in one place. Manage your mobile world the easy way with MyMTN.
MyMTN gives subscribers greater control of their own mobile services so that they can access services and solve issues without having to contact company representatives. MyMTN also ensures customers have access to information about MTN’s products and services whenever the user needs it (24 hours a day) and at their convenience.
Comparable Android apps
The five apps in Productivity with the closest revenue to MyMTN. Click any to see its detail page.
Each forecast combines App Store rating, ratings count, monetisation model, pricing tier, IAP signals and ad-supported flag.
The base estimate is then multiplied by a per-category scaling factor learned from apps with founder-verified MRR.
Every number on this page comes from public APIs and bumetric's own snapshot history.
Full methodology covers input variables, accuracy bands per category and how we treat apps without comparable anchors.
See also the live data on MyMTN's tracker page for current rating, reviews and snapshot timeline.
Building something similar? Get a free AI audit with $-revenue forecasts for every recommendation.


 Screenshot X - Screen Capture
 Habit Tracker
 RS File Manager File Explorer
 DWG FastView-CAD Viewer&Editor
 Super Amazing FlashLight Pro