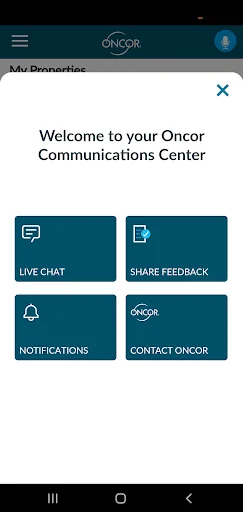
More power at your fingertips. With MyOncor, customers can instantly access their account and report outages, manage new service requests and receive real-time updates from Oncor.
Features include:
REPORT OUTAGES
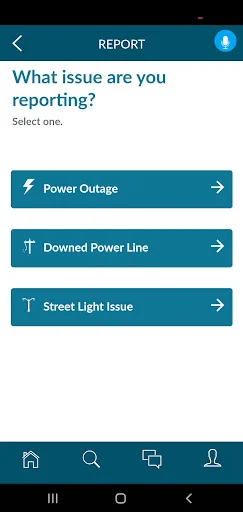
• Report power outage and street light issues
• Check your current outage status and your outage history
• Track estimated restoration times quickly from your mobile device
• View outage information using current location or Google Maps
MANAGE NEW SERVICE REQUESTS
• Start …
More power at your fingertips. With MyOncor, customers can instantly access their account and report outages, manage new service requests and receive real-time updates from Oncor.
Features include:
REPORT OUTAGES
• Report power outage and street light issues
• Check your current outage status and your outage history
• Track estimated restoration times quickly from your mobile device
• View outage information using current location or Google Maps
MANAGE NEW SERVICE REQUESTS
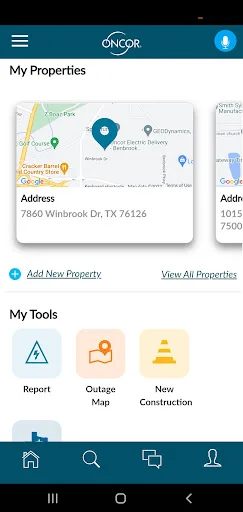
• Start and track new service for your construction project
• Manage multiple properties and locations
• Access builder and developer resources
REAL-TIME ONCOR NEWS UPDATES
• Read articles from Oncor’s blog, The Wire
• Find important safety information to keep you and your family safe before, after and during severe weather
• Receive energy efficiency tips to help manage your energy consumption and save on your electric bill
• Stay up-to-date with Oncor social media accounts
*To use MyOncor, you must be a customer in the Oncor Electric Delivery service territory.
Comparable Android apps
The five apps in Business with the closest revenue to MyOncor. Click any to see its detail page.
Each forecast combines App Store rating, ratings count, monetisation model, pricing tier, IAP signals and ad-supported flag.
The base estimate is then multiplied by a per-category scaling factor learned from apps with founder-verified MRR.
Every number on this page comes from public APIs and bumetric's own snapshot history.
Full methodology covers input variables, accuracy bands per category and how we treat apps without comparable anchors.
See also the live data on MyOncor's tracker page for current rating, reviews and snapshot timeline.
Building something similar? Get a free AI audit with $-revenue forecasts for every recommendation.


 Mobile Facilities by RealPage
 Applications Manager
 Inventory Management
 Toan Quoc
 Indiana Michigan Power