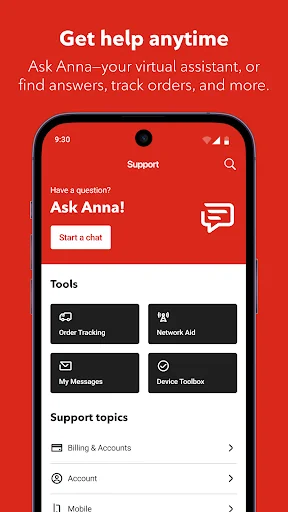
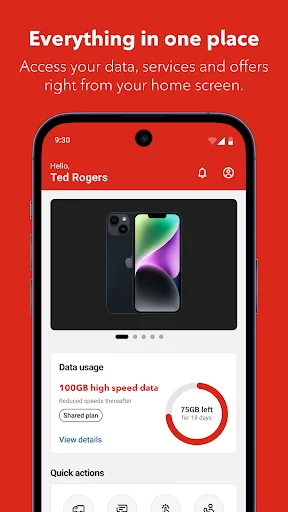
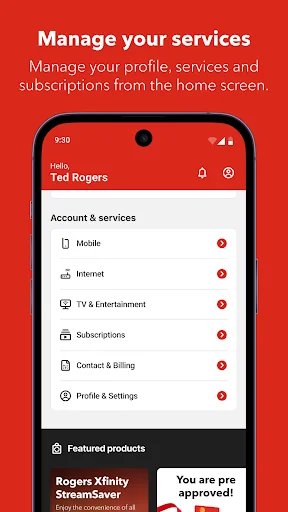
The MyRogers app is an easy and secure way to manage your account from anywhere and to manage your family’s data worry-free.
All customers on a Shared plan get even more from the MyRogers app!
• Top up data before you run out and pause data access for any line
• Monitor your data usage in real time
• Set customizable data alerts for each line
• View your bill and make payments
The MyRogers app is available to Rogers customers with a post-paid account.
Please note: Some Small…
The MyRogers app is an easy and secure way to manage your account from anywhere and to manage your family’s data worry-free.
All customers on a Shared plan get even more from the MyRogers app!
• Top up data before you run out and pause data access for any line
• Monitor your data usage in real time
• Set customizable data alerts for each line
• View your bill and make payments
The MyRogers app is available to Rogers customers with a post-paid account.
Please note: Some Small Business accounts along with corporate customers only have limited access to features through logging in with their Rogers wireless number
Does not currently support pre-paid accounts
Comparable Android apps
The five apps in Tools with the closest revenue to MyRogers. Click any to see its detail page.
Each forecast combines App Store rating, ratings count, monetisation model, pricing tier, IAP signals and ad-supported flag.
The base estimate is then multiplied by a per-category scaling factor learned from apps with founder-verified MRR.
Every number on this page comes from public APIs and bumetric's own snapshot history.
Full methodology covers input variables, accuracy bands per category and how we treat apps without comparable anchors.
See also the live data on MyRogers's tracker page for current rating, reviews and snapshot timeline.
Building something similar? Get a free AI audit with $-revenue forecasts for every recommendation.

 Deleted Photo & Video Recovery
 Default Apps Pro
 De-Bloater Pro (ROOT)
 Subcore • Root
 Barometer & Altimeter