What MyWater EWSU actually does (from store listing)
Welcome to the upgraded Evansville Water & Sewer Utility (EWSU) app, your one-stop solution to managing your utilities smarter and easier! Designed with your convenience in mind, the upgraded EWSU app puts control over your water and sewer services right at your fingertips. Whether you want to view your usage, pay bills, or stay updated on service advisories, it’s all here!
With the EWSU app, you can avail features like:
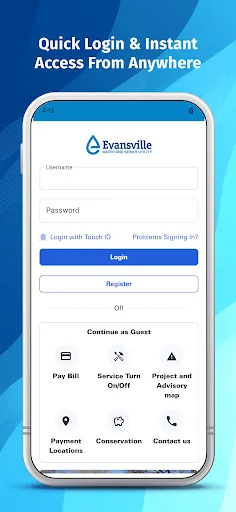
1. Effortless Login: Quick login options that grant you instant access…
Welcome to the upgraded Evansville Water & Sewer Utility (EWSU) app, your one-stop solution to managing your utilities smarter and easier! Designed with your convenience in mind, the upgraded EWSU app puts control over your water and sewer services right at your fingertips. Whether you want to view your usage, pay bills, or stay updated on service advisories, it’s all here!
With the EWSU app, you can avail features like:
1. Effortless Login: Quick login options that grant you instant access to your account, whether you’re at home, at work, or on the go.
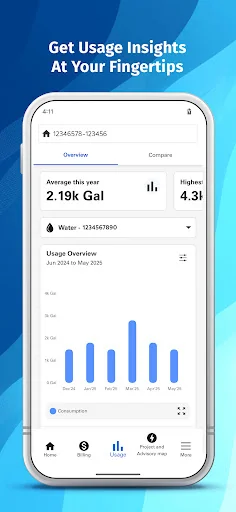
2. Real-Time Usage Tracking: Monitor your water and sewer usage with a tap. Access detailed consumption insights to help you understand your usage patterns, conserve water, and make informed decisions.
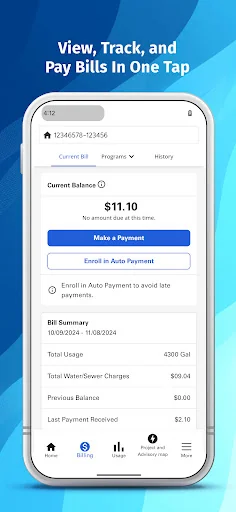
3. Streamlined Billing: View, track, and pay your bills easily. Access your billing history and receive notifications when your bill is due, so you never miss a payment.
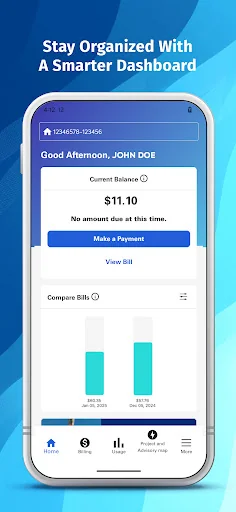
4. Enhanced Dashboard: Experience a user-friendly dashboard that gives you a complete overview of your account; from recent transactions and billing history to usage insights and account notifications.
5. Profile Management: Update your contact details, adjust your account preferences, or delete your profile if needed; all from the comfort of your device.
6. Two-Factor Authentication: Your security matters to us. That’s why we’ve added two-factor authentication to provide extra protection during login.
7. Project & Advisory Map: Stay informed with a live project and advisory map that displays critical updates like Boil advisories and planned maintenance.
The EWSU app upgrade is all about making your experience smoother.
If you have any problems with the app, get support at ewsu.com
Experience a smarter way to manage your utilities. Explore the upgraded EWSU app today and take control of your water and sewer services with ease!
Comparable Android apps
The five apps in Business with the closest revenue to MyWater EWSU. Click any to see its detail page.
Each forecast combines App Store rating, ratings count, monetisation model, pricing tier, IAP signals and ad-supported flag.
The base estimate is then multiplied by a per-category scaling factor learned from apps with founder-verified MRR.
Every number on this page comes from public APIs and bumetric's own snapshot history.
Full methodology covers input variables, accuracy bands per category and how we treat apps without comparable anchors.
See also the live data on MyWater EWSU's tracker page for current rating, reviews and snapshot timeline.
Building something similar? Get a free AI audit with $-revenue forecasts for every recommendation.

 Secure Enterprise Messenger
 Planerio
 BCAgent
 OnTime
 Foodliner Mobile