Get in the zone and make it count, with a social platform and gamification to keep you feeling good, inside and out.
Join an inclusive community fuelled by physical activity, fitness and wellbeing with the heart rate monitor that rewards effort over ability. Or build your own community among your family, friends, and classmates.
At the heart of over 7500 gym chains in over 80 countries, Myzone is a unique wearable fitness brand that rewards effort rather than ability. It's the secret to mo…
Get in the zone and make it count, with a social platform and gamification to keep you feeling good, inside and out.
Join an inclusive community fuelled by physical activity, fitness and wellbeing with the heart rate monitor that rewards effort over ability. Or build your own community among your family, friends, and classmates.
At the heart of over 7500 gym chains in over 80 countries, Myzone is a unique wearable fitness brand that rewards effort rather than ability. It's the secret to motivating anyone to feel good about exercise.
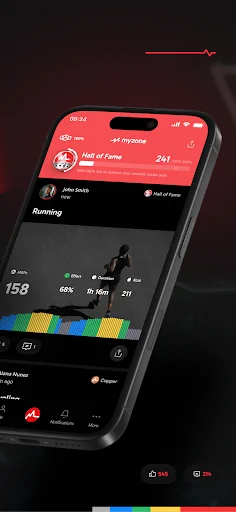
The Myzone app uses inclusive, game-based mechanics and social elements to prove time and time again that we're stronger together. When combined with a Myzone heart rate monitor, the app creates personalised zones, based on your maximum heart rate, which means anyone can compete together on a level playing field.
What is Myzone?
👍 FEEL GOOD INSIDE AND OUT
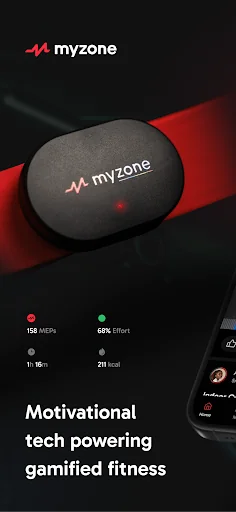
Myzone develops accurate wearable technology, providing engaging and motivational experiences that support lifestyle changes to make exercise habits stick.
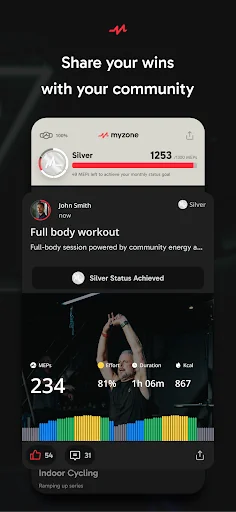
👨👩👧👦 JOIN THE COMMUNITY OR BUILD YOUR OWN
Myzone is used by 1.8 million people around the world at home, outdoors and in our partner gyms such as Snap Fitness, LA Fitness, Bannatyne Health Club, Fitness First, Anytime Fitness, and UFC GYM.
⌚ USE IT YOUR WAY
Myzone connects through analogue, ANT+ and Bluetooth with gym equipment, Apple Watch, Wear OS, Garmin and Samsung Galaxy. It also integrates with third-party apps such as MapMyRun, Strava, and MyFitnessPal.
🎯 THE MOST ACCURATE TRACKERS
Myzone heart rate monitors let you know the exact level that you're working out at, in real time. The heart rate monitoring system features electrocardiography (ECG) measurement that's accurate up to 99.4%, as used by health professionals. The MZ-Switch combines an ECG sensor with a photoplethysmography (PPG) sensor to create the world's first interchangeable heart rate monitor for the gym, outdoors or in water.
⚖️ LEVEL THE PLAYING FIELD
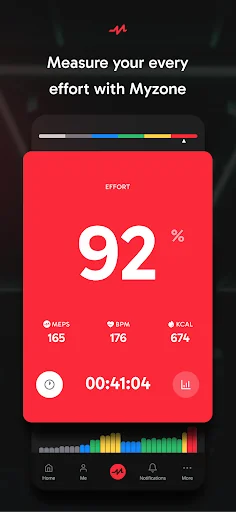
Myzone rewards effort over ability. Each device automatically updates how it records your effort, every time you progress through your goals. The five tailored effort zones make heart rate training easy to understand. Each zone is a percentage of your maximum heart rate, meaning that athletes and fitness newbies can exercise together to earn MEPs (Myzone Effort Points).
🏃 WORLD-CLASS WORKOUTS
Myzone means you can take part in live classes with real studio buzz, wherever you are. Exclusive to the Myzone app, MZ-Remote is the world's first virtual live group workout where participants can connect and exercise together, while receiving real-time biometric feedback and personalised coaching from a trainer.
🏅 LOVED BY THE EXPERTS
Myzone has been featured and reviewed by international journalists from publications such as Men's Fitness, Men's Health, Women's Health, The Huffington Post, GQ, T3, Wired and Esquire for over 10 years.
For more information on how you can join the Myzone community visit www.myzone.org
To see all of the Myzone privacy policies please visit https://www.myzone.org/legal
For the privacy policy relating to app usage please visit https://www.myzone.org/privacy-policy-services
Comparable Android apps
The five apps in Health & Fitness with the closest revenue to Myzone. Click any to see its detail page.
Each forecast combines App Store rating, ratings count, monetisation model, pricing tier, IAP signals and ad-supported flag.
The base estimate is then multiplied by a per-category scaling factor learned from apps with founder-verified MRR.
Every number on this page comes from public APIs and bumetric's own snapshot history.
Full methodology covers input variables, accuracy bands per category and how we treat apps without comparable anchors.
See also the live data on Myzone's tracker page for current rating, reviews and snapshot timeline.
Building something similar? Get a free AI audit with $-revenue forecasts for every recommendation.


 แคลอรี่ ไดอารี่
 Bebac
Bebac
 Centr: Personal Fitness App
 Fitness & Bodybuilding
 Vibration App: Strong Massager