Live screenshots from the Play Store, captured by our snapshot worker. Tap any image to enlarge.
Discover the n11 Android app, your gateway to hundreds of thousands of stores and millions of products — from fashion and electronics to groceries and automotive goods. Enjoy exclusive campaigns and special discounts, only on mobile!
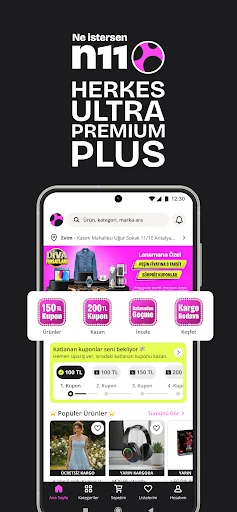
Catch Daily Mobile-Exclusive Deals
Every day between 08:00 and 20:00, explore the unmissable offers section for daily discounts and find exactly what you’re looking for at unbeatable prices. With mobile-only deals that update daily, shopping has never been more re…
Read full description →
Discover the n11 Android app, your gateway to hundreds of thousands of stores and millions of products — from fashion and electronics to groceries and automotive goods. Enjoy exclusive campaigns and special discounts, only on mobile!
Catch Daily Mobile-Exclusive Deals
Every day between 08:00 and 20:00, explore the unmissable offers section for daily discounts and find exactly what you’re looking for at unbeatable prices. With mobile-only deals that update daily, shopping has never been more rewarding!
Categories
• Electronics
Explore thousands of products from top brands like Samsung, Apple, Xiaomi, Oppo, Realme, TCL, LG, Monster, MSI, Dell, Lenovo, Asus, Acer, Huawei, Canon, Nikon, Sony, JBL, Bosch, Philips, and Tefal. Find everything from smartphones, laptops, and TVs to white goods, small kitchen appliances, cameras, and accessories — all in one place.
• Fashion
Shop shoes from Moda Flo, Lumberjack, Nine West, Polaris, Greyder, Scooter, Lacoste, and more. Discover women’s and men’s fashion from brands like Mavi, Penti, Altınyıldız, Colin’s, Avva, Hatemoğlu, Koton, Jack & Jones, Kiğılı, Levi’s, and Ramsey. Also find bags, sunglasses, and special occasion outfits.
• Cosmetics & Personal Care
From fragrances by Avon, Burberry, Dior, Giorgio Armani to hair, face, and skincare, explore a wide range of products — including salon and hairdresser essentials — all available on the n11 app.
• Automotive & Motorcycle
Browse auto accessories, tuning products, and spare parts for Volkswagen, Ford, BMW, Toyota, Audi, and more. Discover Meguiar’s and Sonax car care, TomTom and Garmin navigation devices, and tires by Michelin, Pirelli, Goodyear. Motorcycle gear from Alpinestars, Revit, Arai, and Shoei is also at your fingertips.
• Mom & Baby
Everything for mom and baby — from baby food, clothing, and strollers to health products and maternity essentials — is conveniently gathered in this category.
• Jewelry & Watches
Explore quarter, half, and full gold coins, silver jewelry, Seiko and Michael Kors watches, and diamond rings and necklaces by Altınbaş, Gülaylar, Atasay, and Ariş. Whether you're into collectibles or everyday elegance, this category has it all.
• Sports & Outdoor
Whether you're into fitness, outdoor adventures, or sportswear, find gear from Voit, Dynamic, Adidas, Nike, Puma, The North Face, Columbia, Lafuma, and more. Also shop fishing, hunting, cycling, and marine equipment easily from the app.
• Books, Music, Movies & Games
Dive into video games and consoles by Sony and Nintendo, toys from Lego, Hasbro, Mattel, drones from DJI, books from Pegasus and Epsilon, and stationery from Faber-Castell, Bic, Edding, and Noki.
• Home & Living
Discover everything for your home — furniture, decor, lighting, home textiles by Taç, Merinos, Saray Halı, kitchenware by Schaffer and Korkmaz, and even construction supplies from 3M and Bosch.
App Features
• Safe & Secure Payments
• Easy Returns
• Access to Best Sellers
• Daily Unmissable Offers
• Instant Discounts
The five apps in Shopping with the closest revenue to n11. Click any to see its detail page.
Each forecast combines App Store rating, ratings count, monetisation model, pricing tier, IAP signals and ad-supported flag.
The base estimate is then multiplied by a per-category scaling factor learned from apps with founder-verified MRR.
Every number on this page comes from public APIs and bumetric's own snapshot history.


 getir: groceries in minutes
 Netshoes: loja de esportes!
 Kleinanzeigen - without eBay
 Dollar General-Digital Coupons
 Shopping List: BigBag Pro