ML revenue forecast.
Calibrated against 36598 apps in this category.
Confidence band
±15%
High — many comparable apps with verified data
At a glance
Earns 1.83× more than the category median (154/mo).
Ranks #8,442 of 36,598 in Finance (top 23.1% by revenue).
Launched Sep 28, 2010 · last updated May 04, 2026.
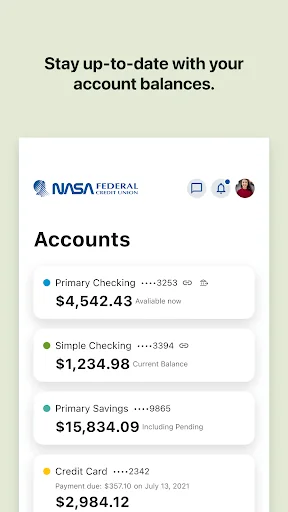
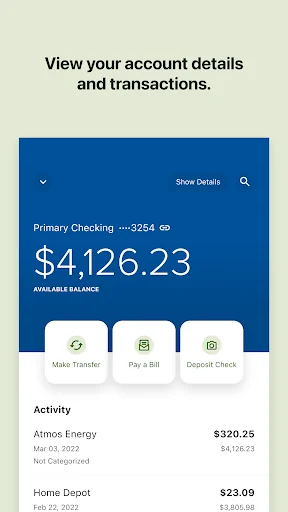
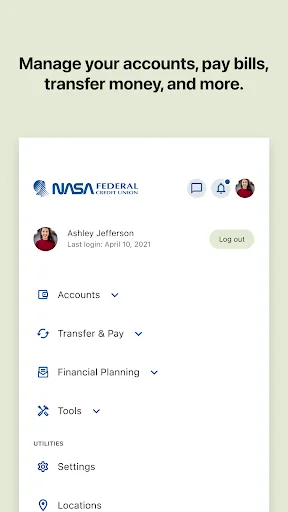
What the app looks like
Live screenshots from the Play Store, captured by our snapshot worker. Tap any image to enlarge.
NASA FCU's revenue trajectory
Forecast revenue from snapshot history. Last 1 months.
Where NASA FCU sits in Finance
Revenue distribution of 36598 comparable apps. NASA FCU highlighted.
NASA FCU vs comparable apps
Revenue trajectory side-by-side. Bold = NASA FCU, ghosted = peers.
App spec
Version
4021.0.2
Last update
May 04, 2026
Launched
Sep 28, 2010
Price
Free
Monetization
Free
What NASA FCU actually does (from store listing)
Digital Banking designed to help you achieve a brighter financial future. That’s Smart. NASA Smart.
The NASA Federal digital banking app brings convenience right to your fingertips. Through its new, simplified design, you’ll be able to find your account information at the speed of light. Manage your finances on-the-go, from anywhere and at any time–in just a few taps.
Engineered to elevate your digital banking experience, the new app delivers:
• Secure access to your accounts 24-7
• St…
Digital Banking designed to help you achieve a brighter financial future. That’s Smart. NASA Smart.
The NASA Federal digital banking app brings convenience right to your fingertips. Through its new, simplified design, you’ll be able to find your account information at the speed of light. Manage your finances on-the-go, from anywhere and at any time–in just a few taps.
Engineered to elevate your digital banking experience, the new app delivers:
• Secure access to your accounts 24-7
• Streamlined navigation
• Biometric Login
• Account alerts sent to you in real time
• A snapshot of your accounts without logging in
• Manage your card on the go with card lock/unlock, alerts, transaction controls, travel notices, and more
• Remote check deposit
• Quick money movement between accounts
• Free access to your Credit Score
• Track spending, set savings goals, and plan for retirement
Learn more at nasafcu.com/digital-banking. Thank you for being a NASA Federal member.
Federally insured by NCUA. Message and data rates may apply.
Comparable Android apps
The five apps in Finance with the closest revenue to NASA FCU. Click any to see its detail page.
Each forecast combines App Store rating, ratings count, monetisation model, pricing tier, IAP signals and ad-supported flag.
The base estimate is then multiplied by a per-category scaling factor learned from apps with founder-verified MRR.
Every number on this page comes from public APIs and bumetric's own snapshot history.
Full methodology covers input variables, accuracy bands per category and how we treat apps without comparable anchors.
See also the live data on NASA FCU's tracker page for current rating, reviews and snapshot timeline.
Building something similar? Get a free AI audit with $-revenue forecasts for every recommendation.

 FlowAccount
 Streetgains: Trade in Stocks
 izibank легкий мобільний банк
 AnandRathi MutualFunds–Client
 Pan Asia Bank