What Neon n Balls actually does (from store listing)
Life in the ’80s in America stands out with Neon on, Disco music, and Retro video games. Everything combines and called cyberpunk style. And it made me remember when I was a kid, I have fallen in love with the retro game that my father bought me when I was 6 years old. One of my favourite games is smashing the bricks with the balls, it made me feel very excited every time I played.
When I and my family walk through downtown for the first time, the advertising panel with Neon on was caught my e…
Life in the ’80s in America stands out with Neon on, Disco music, and Retro video games. Everything combines and called cyberpunk style. And it made me remember when I was a kid, I have fallen in love with the retro game that my father bought me when I was 6 years old. One of my favourite games is smashing the bricks with the balls, it made me feel very excited every time I played.
When I and my family walk through downtown for the first time, the advertising panel with Neon on was caught my eyes and made me feel very excited. And now, after many years, I have a chance to live like an old day with Neon on, disco music, Retro game in a fair for 80’s memory. It made me feel like the old day when I was a kid, playing my favourite game – brick crusher on consoles like what I have done 28 years ago when I was 6.
After the fair, I always obsess with the light of Neon and my favorite game “Bricks smashing”, and that my inspiration to create a game combined with Neon light and bricks game, named “Neon n balls”. I have drawn a lot of pictures with neon on lines and I really want to show it to everyone, so I decided to put a lot of my artwork into this game and show it to everyone, give them a chance to see it, and….smashing it. After Neon light and retro game are parts of my childhood, everything I have done just helps me remind my old day with a new idea, combine an old retro video game style with something modern. I call it “Neon n Balls”. I hope everyone will love it the way I love it.
New featured you will love:
Free to play:
• Play with your friend
• Play with your family
• Free all the time and so on
• Always free to play
Playing the game without WiFi and Mobile Data:
• No WiFi? No problem
• You are traveling and no Mobile data? Just open the app and enjoy the game
• We require no WiFi connection to start the game
• Ply offline and keep getting reward
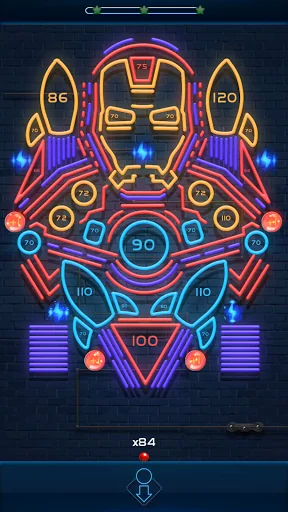
Brand new graphic…and game style:
• Picture draw by neon light
• Beautiful neon artwork
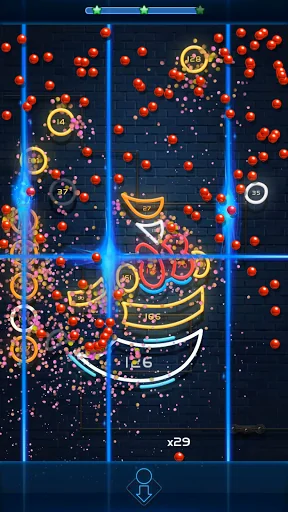
• Colorful balls and neon
• Bricks will be changed into Neon
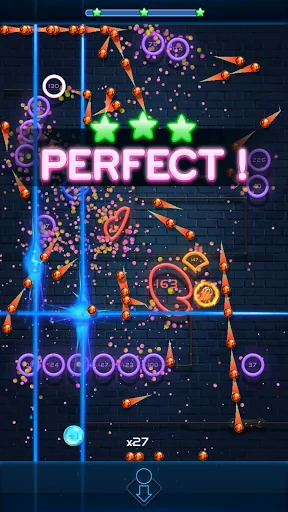
• New game-play
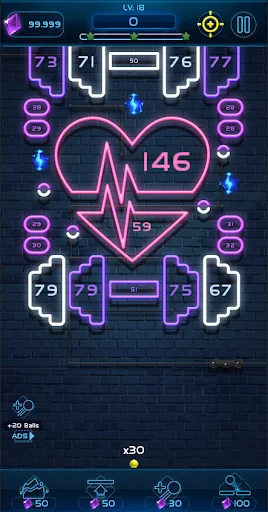
Level up and challenges
• 300+ levels are waiting for you to conquer
• Upgrade your weapon and fire up
• New tool to help you smash the Neon
The retro style combines with modern
• Keeping Essence of retro game… the simply in game-play
• Simply but not simply to be conquered
• You think it easy? Think again, it’s not only smashing the neon, it’s an art
Old but G(old)
• 80’s music background
• 80’s game style
• Retro…but Retro-“er”
• Beautiful Neon light with a modern shape
Comparable Android apps
The five apps in Casual with the closest revenue to Neon n Balls. Click any to see its detail page.
Each forecast combines App Store rating, ratings count, monetisation model, pricing tier, IAP signals and ad-supported flag.
The base estimate is then multiplied by a per-category scaling factor learned from apps with founder-verified MRR.
Every number on this page comes from public APIs and bumetric's own snapshot history.
Full methodology covers input variables, accuracy bands per category and how we treat apps without comparable anchors.
See also the live data on Neon n Balls's tracker page for current rating, reviews and snapshot timeline.
Building something similar? Get a free AI audit with $-revenue forecasts for every recommendation.

 money claw machine
 Hamster Evolution: Merge Idle
 BeatBox
 Jewel Phantom
 God-Tab App