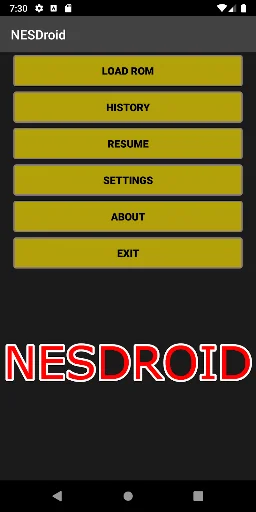
NESDROID
=====
Classic retro emulator. Automatic saving, real time rewinding, cheat file support with browser, custom key bindings, custom touch UI controls, controller support.
FEATURES
=====
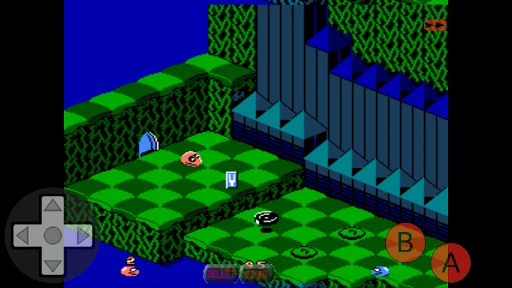
- Multi Touch
- Cheat Browser (browser and enable cheats from .cht files).
- Controller support (DS4, XB, etc).
- Custom key bindings.
- Real time Rewind.
- Fast Forward.
- Auto Save State.
- Auto Save Battery.
- Customize Touch UI placement and size.
- Load/Browse compressed archives (*…
Classic retro emulator. Automatic saving, real time rewinding, cheat file support with browser, custom key bindings, custom touch UI controls, controller support.
FEATURES
=====
- Multi Touch
- Cheat Browser (browser and enable cheats from .cht files).
- Controller support (DS4, XB, etc).
- Custom key bindings.
- Real time Rewind.
- Fast Forward.
- Auto Save State.
- Auto Save Battery.
- Customize Touch UI placement and size.
- Load/Browse compressed archives (*.zip, *.7z).
- Customize rom, state, save directories.
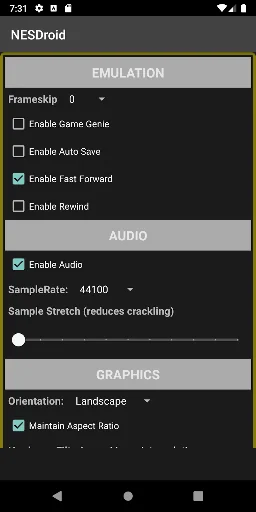
- GameGenie support.
- PAL support.
- Shaders! (hq2x, super eagle, 2xSaI, etc).
USAGE
======
To install ROMS:
- Connect your device to a PC
- Copy ROMS to "/NESDroid/roms/"
OR if you already have roms:
- Go to Settings and adjust Rom Directory
PERMISSIONS
=====
- Needs External storage read/write to load games, save data.
- Needs Internet to download updated shader files
ISSUES
=====
- Send an email.
Comparable Android apps
The five apps in Casual with the closest revenue to NESDroid. Click any to see its detail page.
Each forecast combines App Store rating, ratings count, monetisation model, pricing tier, IAP signals and ad-supported flag.
The base estimate is then multiplied by a per-category scaling factor learned from apps with founder-verified MRR.
Every number on this page comes from public APIs and bumetric's own snapshot history.
Full methodology covers input variables, accuracy bands per category and how we treat apps without comparable anchors.
See also the live data on NESDroid's tracker page for current rating, reviews and snapshot timeline.
Building something similar? Get a free AI audit with $-revenue forecasts for every recommendation.

 EXO game - find a couple
 My Talking Pig
 My Colorful Foal Care Games
 돼지 저금통 키우기 : 직감의 제왕
 Diner Restaurant: Summer