NESN 360 offers a sports viewing experience like you’ve never had before, with access and features like:
· Live Red Sox and Bruins Games
. On-the-go viewing even while traveling outside of New England*
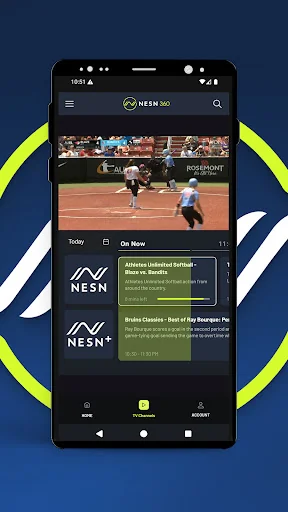
. 24/7 live access to NESN and NESN+
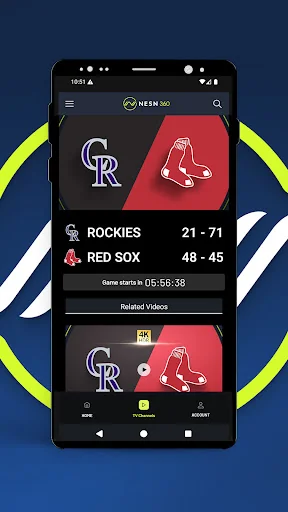
. 4k HDR Streaming on compatible devices
· Live games of the Woo Sox, PWHL, Hockey East, and more
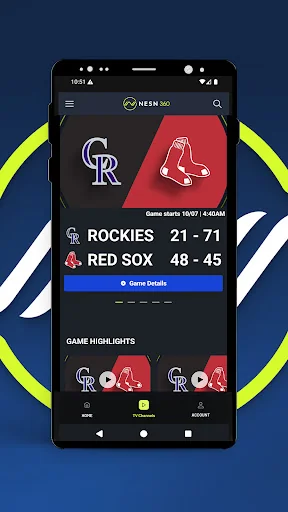
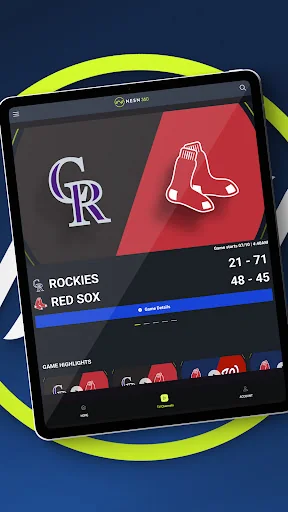
. NESN 360 View’s live player with team stats and standings
. Screen Mirroring to any Smart TV
. Pause, Fast Forward, Rewind and Restart features on Live…
NESN 360 offers a sports viewing experience like you’ve never had before, with access and features like:
· Live Red Sox and Bruins Games
. On-the-go viewing even while traveling outside of New England*
. 24/7 live access to NESN and NESN+
. 4k HDR Streaming on compatible devices
· Live games of the Woo Sox, PWHL, Hockey East, and more
. NESN 360 View’s live player with team stats and standings
. Screen Mirroring to any Smart TV
. Pause, Fast Forward, Rewind and Restart features on Live Games
· Exclusive Shows like Boston Globe Today, Meet Boston, and Dining Playbook
. And many more!
Upgrade your New England sports streaming experience by downloading the app and accessing NESN’s premium content on your favorite devices. NESN’s premium content is available with a participating TV provider or with a NESN 360 subscription. Download the NESN 360 app to start watching!
*Users must first use app within New England (excluding Fairfield County) before using the app while traveling.
For help, visit our FAQ at support.nesn.com.
Privacy Policy: https://nesn.com/privacy-policy/
Terms of Use: https://nesn.com/terms-of-use/
Comparable Android apps
The five apps in Sports with the closest revenue to NESN 360. Click any to see its detail page.
Each forecast combines App Store rating, ratings count, monetisation model, pricing tier, IAP signals and ad-supported flag.
The base estimate is then multiplied by a per-category scaling factor learned from apps with founder-verified MRR.
Every number on this page comes from public APIs and bumetric's own snapshot history.
Full methodology covers input variables, accuracy bands per category and how we treat apps without comparable anchors.
See also the live data on NESN 360's tracker page for current rating, reviews and snapshot timeline.
Building something similar? Get a free AI audit with $-revenue forecasts for every recommendation.

 North Melbourne Official App
 Baseball Live
 TextTV
 Diesel Challenge Pro
 Real France