What NetHome Plus actually does (from store listing)
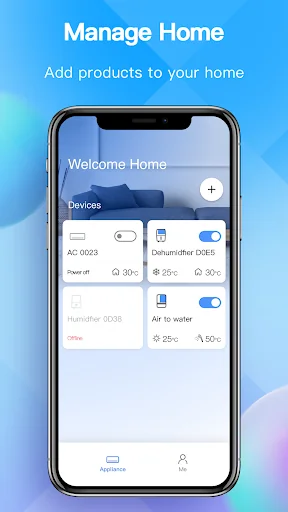
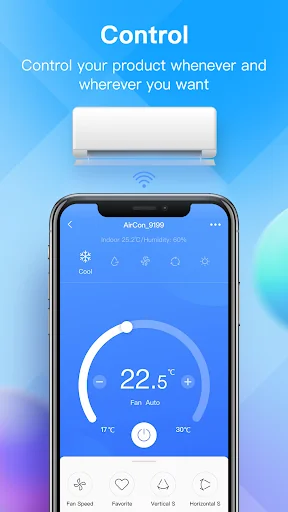
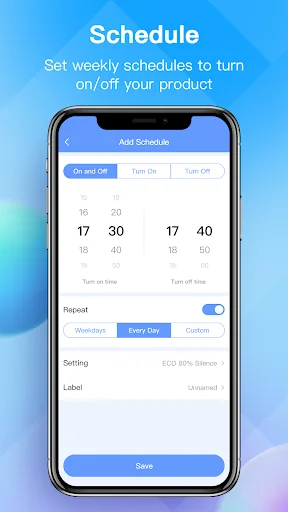
NetHome Plus is one app which belongs to an Air Ecosystem (IOT system), it can be operated with Wifi module and cloud service. The cloud service is powered by AWS(Amazon Web Service), and the chip of Wifi module is powered by Qualcomm. User can easily control AC by using this app which can have following special functions:
1. Simply Control Air conditioner: Comfort, Efficiency, and Safety.
2. New User Experience: Special functions and UI interactive design.
3. Remote Control: Obtain and Mo…
NetHome Plus is one app which belongs to an Air Ecosystem (IOT system), it can be operated with Wifi module and cloud service. The cloud service is powered by AWS(Amazon Web Service), and the chip of Wifi module is powered by Qualcomm. User can easily control AC by using this app which can have following special functions:
1. Simply Control Air conditioner: Comfort, Efficiency, and Safety.
2. New User Experience: Special functions and UI interactive design.
3. Remote Control: Obtain and Modify Your Home Air Quality Anywhere.
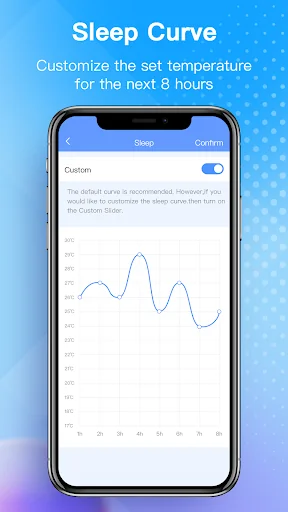
4. Sleep Curve: Customize Your Comfortable Sleep.
5. Time Scheduling: Auto Switch by Appointment Time.
Please check the User Manual for detail information.
Comparable Android apps
The five apps in Tools with the closest revenue to NetHome Plus. Click any to see its detail page.
Each forecast combines App Store rating, ratings count, monetisation model, pricing tier, IAP signals and ad-supported flag.
The base estimate is then multiplied by a per-category scaling factor learned from apps with founder-verified MRR.
Every number on this page comes from public APIs and bumetric's own snapshot history.
Full methodology covers input variables, accuracy bands per category and how we treat apps without comparable anchors.
See also the live data on NetHome Plus's tracker page for current rating, reviews and snapshot timeline.
Building something similar? Get a free AI audit with $-revenue forecasts for every recommendation.
 Easy Drawer - App Organizer
 Notes
Notes
 Dr.Web Mobile Control Center
 Sticker widget
 NetMonster