What NetMonster actually does (from store listing)
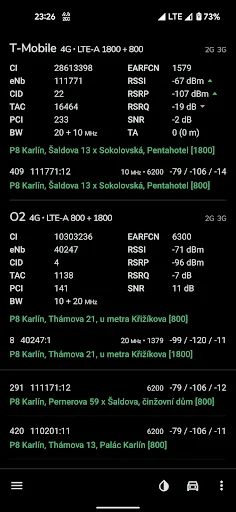
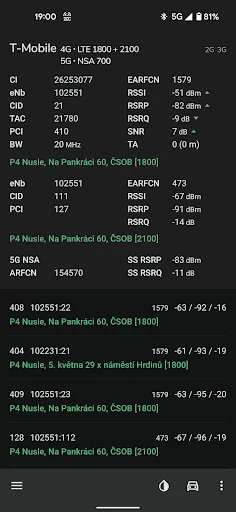
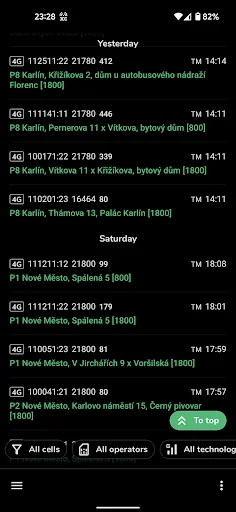
NetMonster collects, shows and stores information about nearby cell towers. Each tower has its unique set of identifiers and NetMonster will show you them. In select areas and countries precise locations are available.
All cells that your phone actively connected to are continuously saved into log till you terminate the app. You can manually correct the location, browse cells on the map, filter them and eventually export all the data.
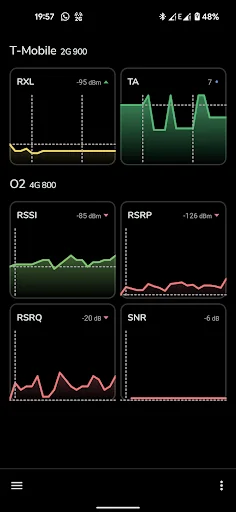
NetMonster also visualises signal changes and provides …
NetMonster collects, shows and stores information about nearby cell towers. Each tower has its unique set of identifiers and NetMonster will show you them. In select areas and countries precise locations are available.
All cells that your phone actively connected to are continuously saved into log till you terminate the app. You can manually correct the location, browse cells on the map, filter them and eventually export all the data.
NetMonster also visualises signal changes and provides short description what given measurement means and how it affects reception quality or theoretical maximal speed.
Supported networks are GSM, CDMA, WCDMA, TD-SCDMA, 4G LTE, 5G NSA and 5G SA. When it comes to LTE, NetMonster also detects aggregated carriers (so-called LTE-Advanced). For areas where 5G NSA is available you can see if NSA is in use or just deployed, carrier aggregation in 4G+5G NSA is also available.
NetMonster is based on open-source library NetMonster Core:
https://github.com/mroczis/netmonster-core
Want to get updates first? Join beta channel!
https://play.google.com/apps/testing/cz.mroczis.netmonster
Comparable Android apps
The five apps in Tools with the closest revenue to NetMonster. Click any to see its detail page.
Each forecast combines App Store rating, ratings count, monetisation model, pricing tier, IAP signals and ad-supported flag.
The base estimate is then multiplied by a per-category scaling factor learned from apps with founder-verified MRR.
Every number on this page comes from public APIs and bumetric's own snapshot history.
Full methodology covers input variables, accuracy bands per category and how we treat apps without comparable anchors.
See also the live data on NetMonster's tracker page for current rating, reviews and snapshot timeline.
Building something similar? Get a free AI audit with $-revenue forecasts for every recommendation.
 Indonesian /AppsTech Keyboards
 Dr.Web Mobile Control Center
 BatterySnap: battery health
 Notes
Notes
 NetHome Plus