1.2M Assets Tracked Updated 3 min ago Revenue Forecasts
Add an app Create Account Sign In
Home
NetVelocity icon

How much does NetVelocity earn?

Android app from Enterprise App Team · Tools

ML forecast ★ 4.1 · 928 Free

~410/mo

ML revenue forecast. Calibrated against 77129 apps in this category.

Confidence band
±15%
High — many comparable apps with verified data

At a glance

What the app looks like

Live screenshots from the Play Store, captured by our snapshot worker. Tap any image to enlarge.

NetVelocity screenshot 1 NetVelocity screenshot 2 NetVelocity screenshot 3 NetVelocity screenshot 4

NetVelocity's revenue trajectory

Forecast revenue from snapshot history. Last 1 months.

Where NetVelocity sits in Tools

Revenue distribution of 77129 comparable apps. NetVelocity highlighted.

NetVelocity vs comparable apps

Revenue trajectory side-by-side. Bold = NetVelocity, ghosted = peers.

App spec

Version
Varies with device
Launched
Dec 27, 2017
Price
Free
Monetization
Free

What NetVelocity actually does (from store listing)

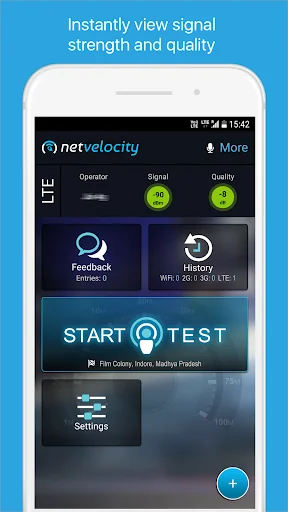
NetVelocity is a multipurpose mobile application that enables users to test, measure, compare and share their network performance - anytime, anywhere.
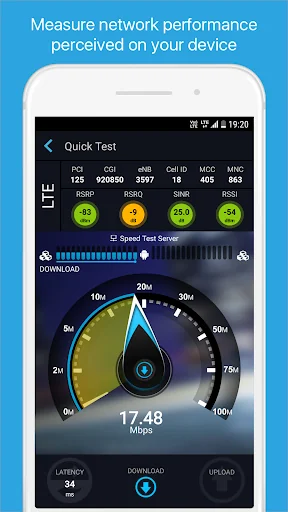
 <b>Speed Test</b> Perform speed tests to get real-time insight into your carrier’s performance. 
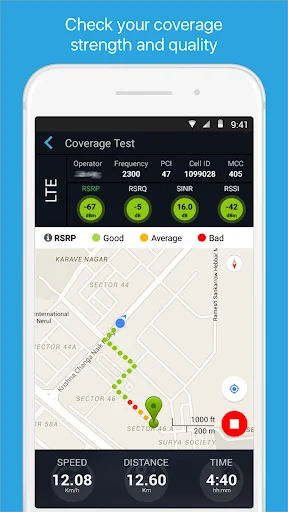
<b>Campaigns & Work Orders</b> Allows enterprise users to manage task, measure in-building coverage, conduct live drive test. <b>Feedback</b> Aggregates and analyzes customer feedback based on events and user feedback.
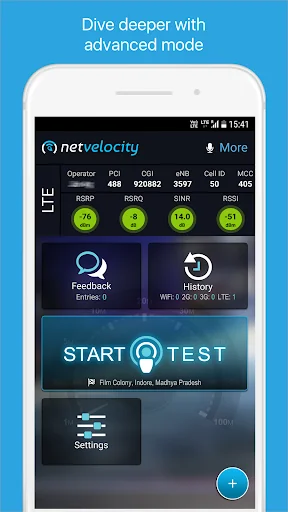
 <b>Engineering …
Read full description →

Comparable Android apps

The five apps in Tools with the closest revenue to NetVelocity. Click any to see its detail page.

AppRevenueRatingRatings
UMeter icon UMeter 410 0
Mi Emasesa icon Mi Emasesa 410 0
Screen Orientations icon Screen Orientations 410 ★ 3.5 758
UniCalc icon UniCalc 410 ★ 4.5 403
Dog Whistle icon Dog Whistle 410 ★ 3.8 5K
Own NetVelocity? Replace our estimate with your real revenue via Stripe Connect or ASC. Get a public Verified badge.
Claim & verify →

How we calculated this

Each forecast combines App Store rating, ratings count, monetisation model, pricing tier, IAP signals and ad-supported flag. The base estimate is then multiplied by a per-category scaling factor learned from apps with founder-verified MRR. Every number on this page comes from public APIs and bumetric's own snapshot history.

Full methodology covers input variables, accuracy bands per category and how we treat apps without comparable anchors. See also the live data on NetVelocity's tracker page for current rating, reviews and snapshot timeline.

Building something similar? Get a free AI audit with $-revenue forecasts for every recommendation.
Audit my app →