A daily routine that includes investing,
Start simply and smartly!
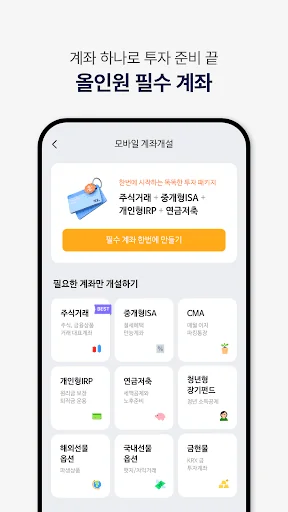
### 1. Key Services
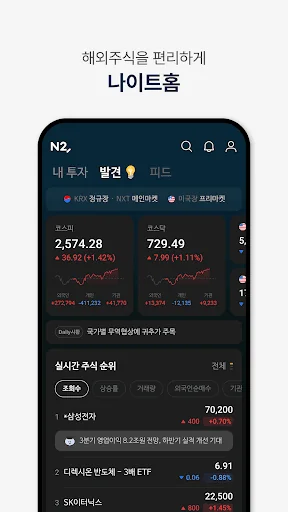
◼︎ 24-Hour Overseas Stocks
Korea's first 24-hour overseas stock trading service, available whenever you want!
Online trading in 9 countries! Currency exchange available in 20 countries!
It is convenient because you can trade in Korean Won without having to exchange currency in advance.
◼︎ Stock Accumulation
What if you deposit your desired amount for your desired period, just like a sav…
Korea's first 24-hour overseas stock trading service, available whenever you want!
Online trading in 9 countries! Currency exchange available in 20 countries!
It is convenient because you can trade in Korean Won without having to exchange currency in advance.
◼︎ Stock Accumulation
What if you deposit your desired amount for your desired period, just like a savings account?
It automatically purchases stocks or ETFs to accumulate your holdings steadily.
The risk is low because it consistently purchases a fixed amount!
◼︎ My Dividend Service
Want to receive solid dividends from N2?
Check the dividend schedule and information for your holdings in "My Dividends,"
and create your own dividend stock portfolio!
◼︎ Direct Indexing
Want to create your own index to invest?
Check NH expert-recommended indices,
and build your own index to directly construct your stock portfolio.
◼︎ Advisor Investment Consultation
Personalized investment consultation conducted directly by professional advisors with over 10 years of experience!
### 2. New Features
◼︎ Receive IMA Launch Notifications
Do you want to invest stably while protecting your principal?
Sign up for advance notifications and be the first to know!
◼︎ Turn Your Child into an Economic Expert: Opening a Child's Account
Easily open and manage your child's account remotely!
You can gift investment funds and stocks to your child~
Instill financial literacy and an investment mindset from a young age!
◼︎ Widgets You See Every Time You Turn On Your Screen
Do you want to check information directly from your home screen?
You can check indices and stocks registered in your interest groups!
Various characters appear to notify you based on your rate of return!
### 3. Learn More
◼︎ Chatbot Noah, Solving Your Questions 24/7
Have questions while using the app?
We provide updates on stock market terms, investment news, IPO schedules, ongoing events, and more.
The more you use it, the smarter you become!
◼︎ Year-End Tax Settlement Preview
How much will I get back from the year-end tax settlement?
Prepare for your 13th month salary with N2!
◼︎ Why is it moving?
Why is this US stock moving?
Receive notifications explaining the reasons for sharp fluctuations!
◼︎ Want to know more?
- Website: https://m.nhsec.com/main/main
- YouTube: https://youtube.com/@nhinvest_login
### 4. System Requirements
◼︎ OS Version
You must use Android OS 5.0 or higher.
** If you are using a smartphone with an Android OS version lower than 6.0, all access permissions may be required. If you upgrade your Android OS to version 6.0 or higher, the access permissions you previously agreed to in the existing app will not change. Therefore, to reset the permissions, you must delete and reinstall the app.
** If you are using a smartphone running Android OS 6.0 or higher, you can individually select whether to agree to access permissions via Phone Settings > Application Manager > NH Investment & Securities N2 > Permissions screen.
** ◼︎ Guide to App Permissions and Usage Purposes
- Files and Media [Storage Space] (Required): Stock information, screen files, user settings, etc.
- Collection/Use of Mobile Phone Number Information (Required): Identity verification, certificate issuance/management, device information verification, connection to customer center
- Camera (Optional): Taking photos of ID cards when opening an online account
- Location (Optional): Checking current location information when opening an online account or searching for branches
- Permission to display over other apps (Optional): Using Visual ARS
- Contacts (Optional): Linking contacts when gifting stocks
** Even if you do not use the optional access permissions, you can still use the service excluding those permissions.
### 5. Other
- To provide services such as customer verification and notifications, we transmit and store your mobile phone number and device ID on our server upon login.
- This app displays informational or commercial mobile content provided by the caller. To this end, we provide your phone number and app push information to Colgate Co., Ltd.
- Provided Function: Call-related screen service (Visual ARS)
- Retention and Usage Period: Until the provider withdraws consent
- Refusal to Provide / Withdrawal of Consent: 080-135-1136 (Toll-free)
Comparable Android apps
The five apps in Finance with the closest revenue to NH투자증권 N2. Click any to see its detail page.
Each forecast combines App Store rating, ratings count, monetisation model, pricing tier, IAP signals and ad-supported flag.
The base estimate is then multiplied by a per-category scaling factor learned from apps with founder-verified MRR.
Every number on this page comes from public APIs and bumetric's own snapshot history.
Full methodology covers input variables, accuracy bands per category and how we treat apps without comparable anchors.
See also the live data on NH투자증권 N2's tracker page for current rating, reviews and snapshot timeline.
Building something similar? Get a free AI audit with $-revenue forecasts for every recommendation.


 The Boubyan App
 SEB Estonia
 Кредит Онлайн - займ швидко
 Jana Bank Mobile Banking
 HVCU
HVCU