The Rush to the Playoffs is on and only one team will lift the Stanley Cup.
The NHL App is your home for the Stanley Cup Playoffs, featuring:
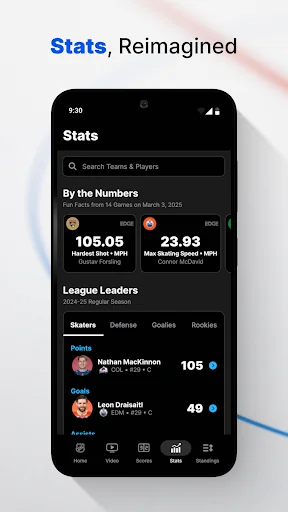
– Stats, reimagined. We’ve got League and Playoff Leaders, and a whole lot more. Explore more EDGE Advanced Stats, Data Visualizations and new ways of looking at the game.
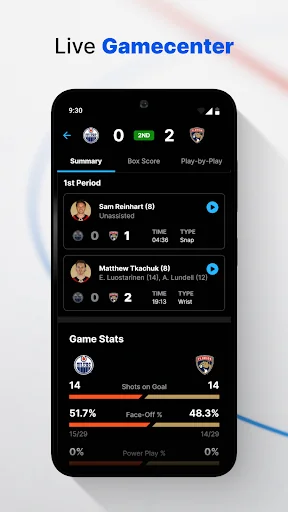
– A refreshed design updates & optimizes Gamecenter.
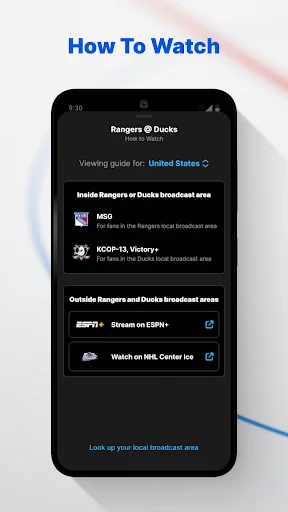
– How to Watch: With more ways than ever to watch a game we've got you covered – all the info to know where to stream,…
The Rush to the Playoffs is on and only one team will lift the Stanley Cup.
The NHL App is your home for the Stanley Cup Playoffs, featuring:
– Stats, reimagined. We’ve got League and Playoff Leaders, and a whole lot more. Explore more EDGE Advanced Stats, Data Visualizations and new ways of looking at the game.
– A refreshed design updates & optimizes Gamecenter.
– How to Watch: With more ways than ever to watch a game we've got you covered – all the info to know where to stream, tune in or follow along.
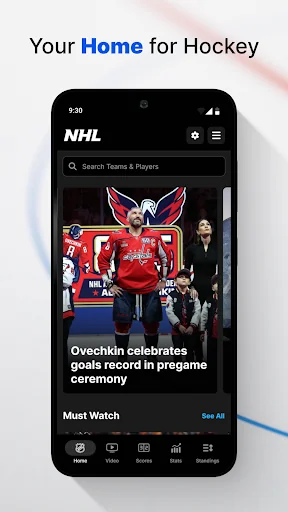
Experience all the NHL App has to offer just the way you like it: breaking news notifications, up-to-the-minute scores and live Gamecenter, new EDGE stats, Game Stories & video highlights, your favorite team’s icon plus Goal Horn game alerts & much more.
By downloading and using the NHL® app, you acknowledge and agree that (i) you have read, understood and agreed to be bound by the NHL.com Terms of Service (https://www.nhl.com/info/terms-of-service) and (ii) the information you provide will be handled in accordance with the NHL.com Privacy Policy (https://www.nhl.com/info/privacy-policy).
Features and content within the NHL® app are subject to change.
NHL, the NHL Shield and the word mark and image of the Stanley Cup are registered trademarks of the National Hockey League.
Each forecast combines App Store rating, ratings count, monetisation model, pricing tier, IAP signals and ad-supported flag.
The base estimate is then multiplied by a per-category scaling factor learned from apps with founder-verified MRR.
Every number on this page comes from public APIs and bumetric's own snapshot history.
Full methodology covers input variables, accuracy bands per category and how we treat apps without comparable anchors.
See also the live data on NHL's tracker page for current rating, reviews and snapshot timeline.
Building something similar? Get a free AI audit with $-revenue forecasts for every recommendation.
 Guns Master
 Absolute RC Heli Sim
 aTides
 Jetting Rotax Max EVO Kart - M
 CheerCast