What Ninja Jump actually does (from store listing)
Living in the technological age, countless machines still hide somewhere where the ninja players help save people, overcome all hardships.
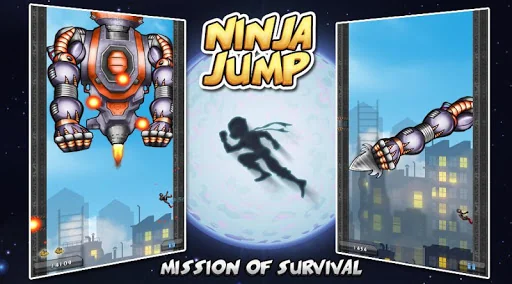
Introducing the new game and extremely attractive Ninja Jump. Fighting with explosive, uncontrollable machines, it's time for the new ninja to rescue the city.
With new upgrades you will increase your stamina, and you can dissipate your attacking machines. Your suitcase when absorbed from the attacker will have outstanding strength.
★ Options and tricks …
Living in the technological age, countless machines still hide somewhere where the ninja players help save people, overcome all hardships.
Introducing the new game and extremely attractive Ninja Jump. Fighting with explosive, uncontrollable machines, it's time for the new ninja to rescue the city.
With new upgrades you will increase your stamina, and you can dissipate your attacking machines. Your suitcase when absorbed from the attacker will have outstanding strength.
★ Options and tricks play:
- The higher you jump, the more difficult the level of the game, the stronger the opponent.
- Your bonus will be available after each level
- Absorbing the beat from the machines so that the ability is immortal
- Very nice graphics
- Training skills
- True sound
- Ninja jumps through the night protecting the city
Want to become a true ninja, work hard to practice today to protect the city from the devastating robots. Let's jump high, destroy all enemies in the way
Use the weapon, equip the rational path, seek new targets to achieve.
★ Features:
- The game is free, no fees
- Feature in Ninja Jump is the ability to train, the skill to overcome the challenge
- Equipped with the latest technology, the hidden power inside the suit you need to find
If you have difficulty in playing or contributing to the game can develop. Or email us at: haigamethudang@gmail.com
Comparable Android apps
The five apps in Casual with the closest revenue to Ninja Jump. Click any to see its detail page.
Each forecast combines App Store rating, ratings count, monetisation model, pricing tier, IAP signals and ad-supported flag.
The base estimate is then multiplied by a per-category scaling factor learned from apps with founder-verified MRR.
Every number on this page comes from public APIs and bumetric's own snapshot history.
Full methodology covers input variables, accuracy bands per category and how we treat apps without comparable anchors.
See also the live data on Ninja Jump's tracker page for current rating, reviews and snapshot timeline.
Building something similar? Get a free AI audit with $-revenue forecasts for every recommendation.


 Bible Sorting Game
 Space Defence
 Sushi Diner - Fun Cooking Game
 Ice Princess Coloring Pages
 Rainy attic room