The NIU App provides users with comprehensive vehicle services, including:
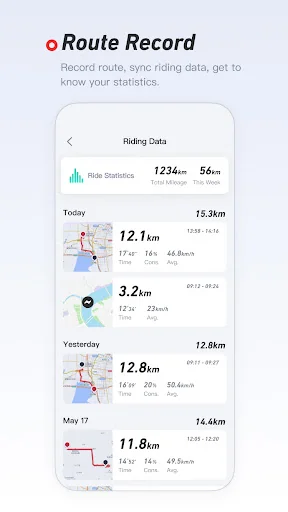
• Vehicle: Remaining battery level and range estimate, GPS positioning, security alert, past routes and riding statistics;
• Service: Service station inquiry, intelligent service activation and inquiry;
• Me: Vehicle management, personal and binding information management, App Settings.
We would like to express our sincere appreciation to your patience and companionship. The more flexible NIU App is available now.
…
The NIU App provides users with comprehensive vehicle services, including:
• Vehicle: Remaining battery level and range estimate, GPS positioning, security alert, past routes and riding statistics;
• Service: Service station inquiry, intelligent service activation and inquiry;
• Me: Vehicle management, personal and binding information management, App Settings.
We would like to express our sincere appreciation to your patience and companionship. The more flexible NIU App is available now.
For more information, please visit niu.com.
Comparable Android apps
The five apps in Auto & Vehicles with the closest revenue to NIU. Click any to see its detail page.
Each forecast combines App Store rating, ratings count, monetisation model, pricing tier, IAP signals and ad-supported flag.
The base estimate is then multiplied by a per-category scaling factor learned from apps with founder-verified MRR.
Every number on this page comes from public APIs and Bumetric's own snapshot history.
Full methodology covers input variables, accuracy bands per category and how we treat apps without comparable anchors.
See also the live data on NIU's tracker page for current rating, reviews and snapshot timeline.
Building something similar? Get a free AI audit with $-revenue forecasts for every recommendation.


 Car comparison engine – OOYYO
 CarDiary - Expenses and fuel
 MTab
 Glimra
 Deep OBD