Maximize your body and mind capabilities.
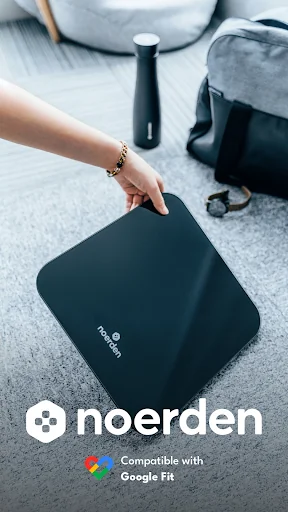
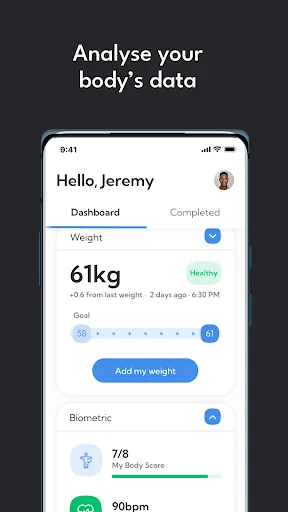
We measure your biometric data through innovative fitness tech devices such as smart body scales, smart bottles and hybrid smartwatches.
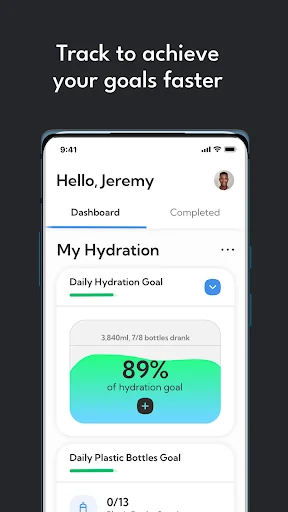
We analyze your data with our algorithms and provide you with simple daily guidance, adapted to your profile, on our mobile application.
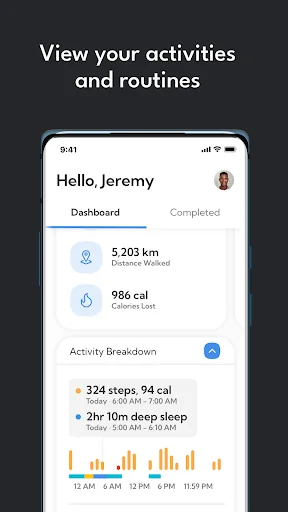
With the app you can:
- better understand your biometrics
- set your fitness goals
- track your activity
- track your progress
- work out with friends with our new Soci…
We measure your biometric data through innovative fitness tech devices such as smart body scales, smart bottles and hybrid smartwatches.
We analyze your data with our algorithms and provide you with simple daily guidance, adapted to your profile, on our mobile application.
With the app you can:
- better understand your biometrics
- set your fitness goals
- track your activity
- track your progress
- work out with friends with our new Social Fitness App
- synch your data with Google Fit
- get notified by your hybrid NOERDEN smartwatch when receiving SMS and incoming calls. this functionality is compatible with the following NOERDEN watches LIFE, MATE, LIFE2, MATE2 and MATE2+
Comparable Android apps
The five apps in Health & Fitness with the closest revenue to Noerden. Click any to see its detail page.
Each forecast combines App Store rating, ratings count, monetisation model, pricing tier, IAP signals and ad-supported flag.
The base estimate is then multiplied by a per-category scaling factor learned from apps with founder-verified MRR.
Every number on this page comes from public APIs and bumetric's own snapshot history.
Full methodology covers input variables, accuracy bands per category and how we treat apps without comparable anchors.
See also the live data on Noerden's tracker page for current rating, reviews and snapshot timeline.
Building something similar? Get a free AI audit with $-revenue forecasts for every recommendation.
 Stretching Yoga Exercise at Ho
 Splits, Spagat in 30 Days
 Body Groove
 FitBark GPS for Dogs & Cats
 UCHealth