***Now backup/restore to Google Drive or Dropbox***
Take notes and even attach your free hand drawing, everything in style and completely without papers!
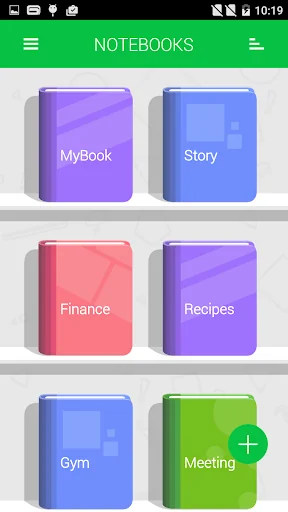
Create multiple notebooks for every subject and avoid messing up your notes.
Notebooks is the only application you will ever need for all your note making needs.
Designed with flexibility and ease of use in mind, taking notes is now at it simplest with our application. With multiple colors and custom title for each notebook cover, you …
***Now backup/restore to Google Drive or Dropbox***
Take notes and even attach your free hand drawing, everything in style and completely without papers!
Create multiple notebooks for every subject and avoid messing up your notes.
Notebooks is the only application you will ever need for all your note making needs.
Designed with flexibility and ease of use in mind, taking notes is now at it simplest with our application. With multiple colors and custom title for each notebook cover, you will enjoy creating a notebook for every subject you want.
Notebooks is a must have application for students, business men and for anyone using their phones and tablets for taking notes.
*The permission GET_ACCOUNTS is to communicate with the Google Drive to backup the data. We do not store your account details in the app.
Features:
1. Create multiple notebooks.
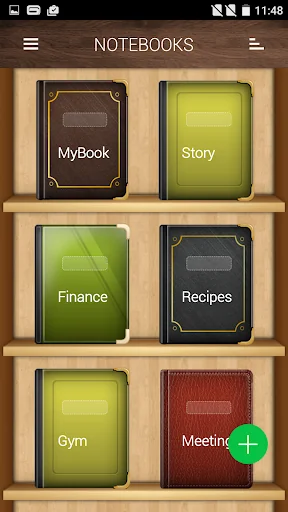
2. Customizable cover, title, number of pages and page style for every notebook.
3. Password protected.
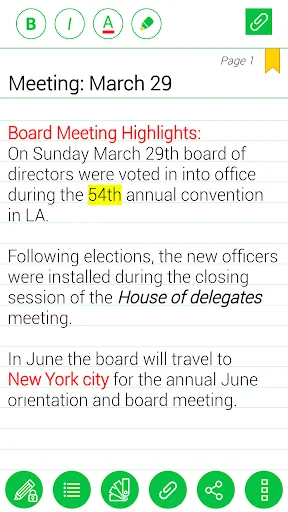
4. Set a title for every page.
5. Instant search within each notebook.
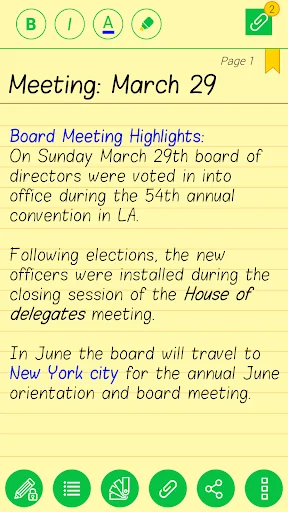
6. Attach image files.
7. Bookmark a page.
8. Create your own free hand drawing.
9. Easily find your entries.
10. Custom fonts for each notebooks.
11. Set theme for each notebook.
12. Convert the entire Notebook to PDF with attachments. (Currently supports English only)
13. Apply text styles such as Bold, Italics and Colored-Highlights
14. Backup/Restore.
(***Option available in the menu of the Notebooks screen. Some devices will not have the hardware menu
button on the device, in that case 'long press' the 'All Apps' button to get the menu on the app***)
15. Backup to Google Drive (Works on devices with OS higher than version 2.2)
How to use?
1. Use '+' mark in the home screen to create new books.
2. Long tap on any book to edit/delete the book.
3. Use 'Password' option to set/reset the password.
4. On the Page tap on Page Header to set the Title for the page.
5. Make use of different editing options provided at the bottom of the page.
Note : Kindly download the verified app only from Google Play. Do not download the app from any other app sharing sites.
Comparable Android apps
The five apps in Lifestyle with the closest revenue to Notebooks. Click any to see its detail page.
Each forecast combines App Store rating, ratings count, monetisation model, pricing tier, IAP signals and ad-supported flag.
The base estimate is then multiplied by a per-category scaling factor learned from apps with founder-verified MRR.
Every number on this page comes from public APIs and bumetric's own snapshot history.
Full methodology covers input variables, accuracy bands per category and how we treat apps without comparable anchors.
See also the live data on Notebooks's tracker page for current rating, reviews and snapshot timeline.
Building something similar? Get a free AI audit with $-revenue forecasts for every recommendation.

 Yodha My Astrology Horoscope
 Daily Supplications
 Write on Pictures App
 TopU - video chat online
 Socken Größentabellen