1.9M Assets Tracked Updated 4 min ago Revenue Forecasts
Create Account Sign In
Home Optimize
NV Energy icon

How much does NV Energy earn?

iOS app from NVEnergy · Utilities

ML forecast ★ 4.7 · 8K → Stable Free

~1.0K/mo

ML revenue forecast. Calibrated against 2781 apps in this category.

Confidence band
±15%
High — many comparable apps with verified data

At a glance

What the app looks like

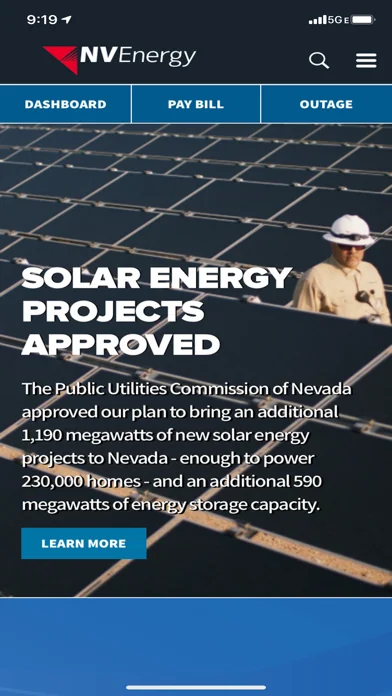
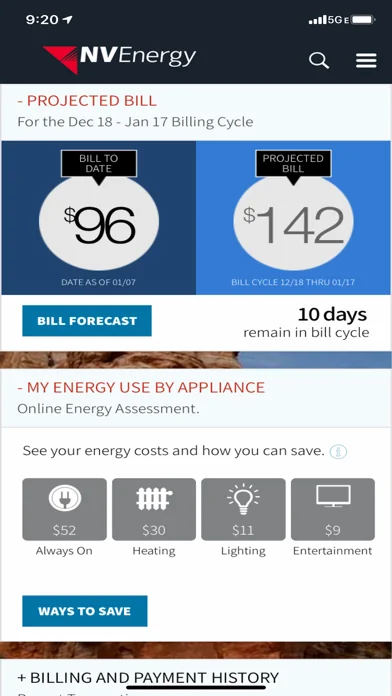
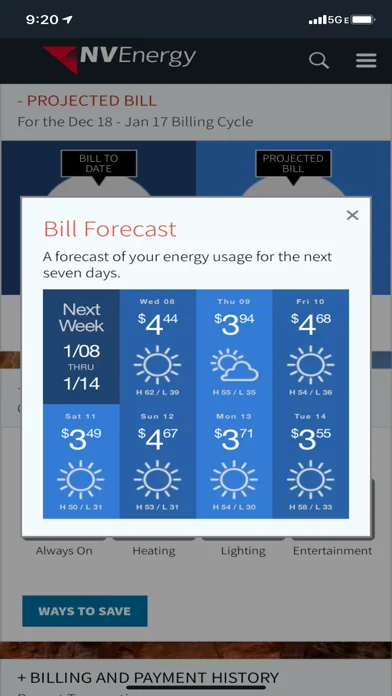
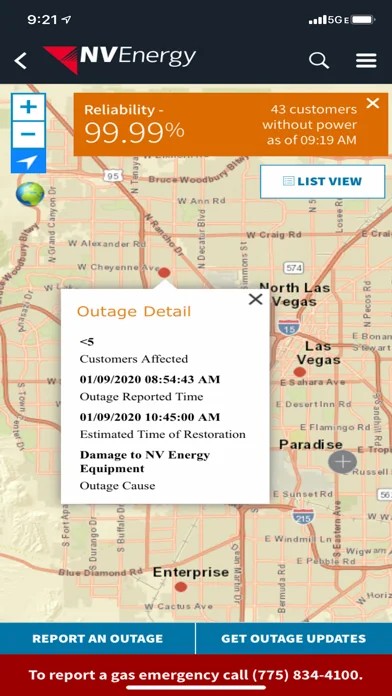
Live screenshots from the App Store, captured by our snapshot worker. Tap any image to enlarge.

NV Energy screenshot 1 NV Energy screenshot 2 NV Energy screenshot 3 NV Energy screenshot 4

NV Energy's revenue trajectory

Forecast revenue from snapshot history. Last 2 months.

Where NV Energy sits in Utilities

Revenue distribution of 2781 comparable apps. NV Energy highlighted.

NV Energy vs comparable apps

Revenue trajectory side-by-side. Bold = NV Energy, ghosted = peers.

App spec

Version
3.11
Last update
Apr 30, 2026
Launched
May 10, 2015
Min OS
14.0
Rating
4+
Price
Free
Monetization
Free
Languages
EN

What NV Energy actually does (from App Store listing)

NV Energy’s mobile app provides an enhanced, personalized digital experience based on customer feedback. New and improved features make it easy for customers to login with their fingerprint, pay their bill, understand their energy use, enroll in energy alerts and sign up for money-saving products and services. The app includes an improved Outage Center, which provides details on an outage location and cause and lets customers report and receive outage updates.

🆕 What's new · v3.11

Bug fixes and performance enhancements

Comparable iOS apps

The five apps in Utilities with the closest revenue to NV Energy. Click any to see its detail page.

AppRevenueRatingRatings
Remote Control for Roku TV ◦ icon Remote Control for Roku TV ◦ 1.0K ★ 4.7 8K
Battery Life icon Battery Life 1.0K ★ 4.6 33K
Notan icon Notan 1.0K ★ 4.6 48
Crazy Morse Code icon Crazy Morse Code 1.0K ★ 4.5 2
Waschen – Wäschesymbole icon Waschen – Wäschesymbole 1.0K 0
Own NV Energy? Replace our estimate with your real revenue via Stripe Connect or ASC. Get a public Verified badge.
Claim & verify →

How we calculated this

Each forecast combines App Store rating, ratings count, monetisation model, pricing tier, IAP signals and ad-supported flag. The base estimate is then multiplied by a per-category scaling factor learned from apps with founder-verified MRR. Every number on this page comes from public APIs and bumetric's own snapshot history.

Full methodology covers input variables, accuracy bands per category and how we treat apps without comparable anchors. See also the live data on NV Energy's tracker page for current rating, reviews and snapshot timeline.

Building something similar? Get a free AI audit with $-revenue forecasts for every recommendation.
Audit my app →