Your story lives in the Times of Northwest Indiana. From reporting on all of your favorite teams to the news that matters most in your community, we cover it all. Get in-depth stories from the region and beyond – including news, sports, opinion, obituaries, entertainment, and politics.
Easily access the very latest news in an app built for you. Read, see, and hear exclusive commentary, stunning photography, video updates, and binge-worthy podcasts.
Plus, subscribers have the ability to upg…
Your story lives in the Times of Northwest Indiana. From reporting on all of your favorite teams to the news that matters most in your community, we cover it all. Get in-depth stories from the region and beyond – including news, sports, opinion, obituaries, entertainment, and politics.
Easily access the very latest news in an app built for you. Read, see, and hear exclusive commentary, stunning photography, video updates, and binge-worthy podcasts.
Plus, subscribers have the ability to upgrade to News+, our premium ad-free experience! That means faster-loading pages and an uninterrupted reading experience.
Our app features:
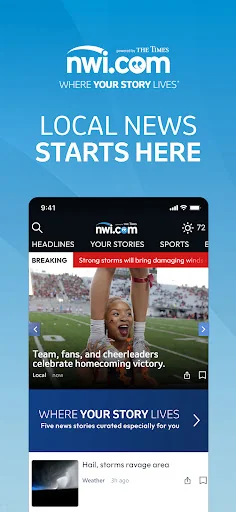
* Your Stories – personalize your experience by selecting the local news topics that matter most to you
* Get notified – stay in the loop by selecting alerts for news, sports, weather, and more
* Easy navigation – see all the latest local stories by simply swiping up/down, and left/right.
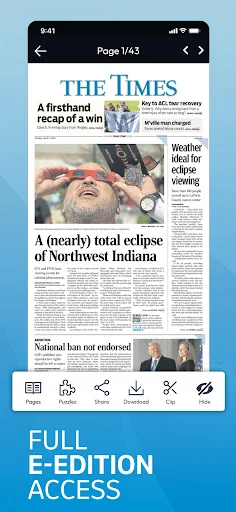
* Read stories your way – either in the News Feed or via the E-edition
* Breaking news updates – top banners let you know what’s happening right now
* Follow author – get notifications whenever your favorite writers post a story
* Bookmark for later – save stories to enjoy at your leisure
* Listen to articles – press the play button to listen instead
* Customize your text size – make the content bigger or smaller in your profile settings
* Weather where you are – hourly, 10-day forecasts, and frequent video updates
Free to download. Subscribers enjoy unlimited access – Google Pay accepted.
Comparable Android apps
The five apps in News & Magazines with the closest revenue to NWI Times. Click any to see its detail page.
Each forecast combines App Store rating, ratings count, monetisation model, pricing tier, IAP signals and ad-supported flag.
The base estimate is then multiplied by a per-category scaling factor learned from apps with founder-verified MRR.
Every number on this page comes from public APIs and bumetric's own snapshot history.
Full methodology covers input variables, accuracy bands per category and how we treat apps without comparable anchors.
See also the live data on NWI Times's tracker page for current rating, reviews and snapshot timeline.
Building something similar? Get a free AI audit with $-revenue forecasts for every recommendation.


 Daily Mirror
 Vox Explainer News
 Kompas TV - Live Streaming
 Censored.TV
 Lübecker Nachrichten E-Paper