Your financial life, connected and personalized
Experience a simpler way to manage your money anytime, anywhere.
With the NYC DCP app, you get a comprehensive, secure, and personalized financial experience designed to help you stay on track for your future.
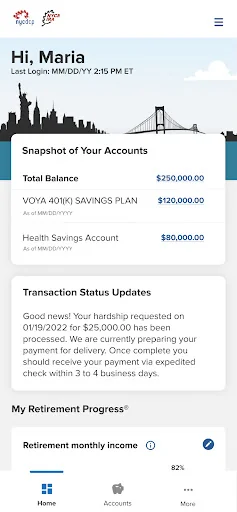
All-in-one access
View and manage your retirement, health savings, and investment accounts in one place—alongside external accounts like checking, savings, and credit cards—for a complete picture of your financial life.
Interactiv…
Experience a simpler way to manage your money anytime, anywhere.
With the NYC DCP app, you get a comprehensive, secure, and personalized financial experience designed to help you stay on track for your future.
All-in-one access
View and manage your retirement, health savings, and investment accounts in one place—alongside external accounts like checking, savings, and credit cards—for a complete picture of your financial life.
Interactive tools & resources
Model retirement income* with myOrangeMoney®, access video education, live chat support, and investment advice all designed to help you take confident action.
Secure and private
Your data is protected with enhanced encryption, multi-factor authentication, biometric voice ID, and our SAFE guarantee. We never sell your personal information—ever.
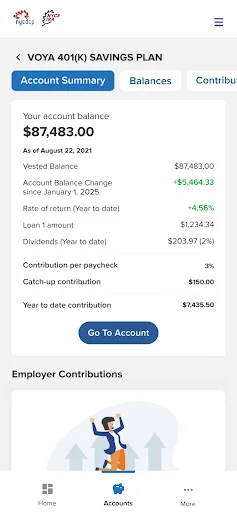
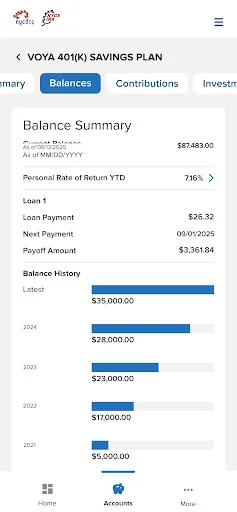
Streamlined experience
Clean design and intuitive navigation make it easy to check balances, update contributions and beneficiaries, and manage your investments all while on the go. Plus, the entire app is also available in Spanish.
Wherever life takes you, the NYC DCP app, goes with you.
Log in today to experience your upgraded financial journey — personalized, secure, and built to help you retire with confidence.
* IMPORTANT : The illustrations or other information generated by the calculators are hypothetical in nature, do not reflect actual investment results, and are not guarantees of future results. This information does not serve, either directly or indirectly, as legal, financial or tax advice and you should always consult a qualified professional legal, financial and/or tax advisor when making decisions related to your individual tax situation.
Products and services offered through the Voya® family of companies.
Comparable Android apps
The five apps in Finance with the closest revenue to NYC DCP. Click any to see its detail page.
Each forecast combines App Store rating, ratings count, monetisation model, pricing tier, IAP signals and ad-supported flag.
The base estimate is then multiplied by a per-category scaling factor learned from apps with founder-verified MRR.
Every number on this page comes from public APIs and bumetric's own snapshot history.
Full methodology covers input variables, accuracy bands per category and how we treat apps without comparable anchors.
See also the live data on NYC DCP's tracker page for current rating, reviews and snapshot timeline.
Building something similar? Get a free AI audit with $-revenue forecasts for every recommendation.

 Moneydance
 Faisal Cash
 Postal Finance Mastercard
 Stock Monster-Intraday Calls
 Toyota Bank