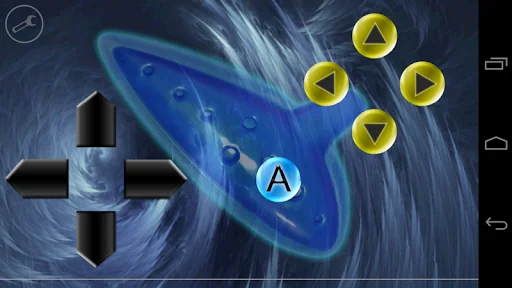
Play the ocarina, drums, guitar or even trumpets with this app. They are all integrated!
The sound system of this app allows you to set the pitch of a note on the go (Android 3.0+).
<b>More features:</b>
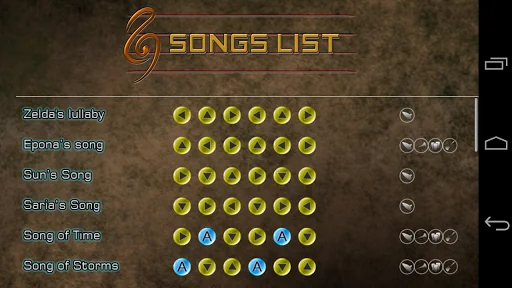
• You can enable or disable song recognition (so you can play freely).
• In this app, sounds can be held for about 5 seconds and have a soft decay.
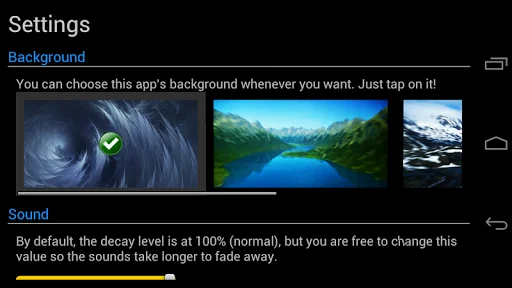
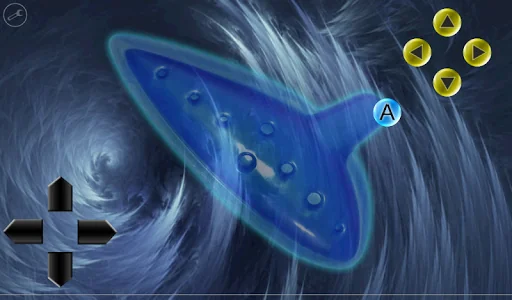
• You can change the background of the app anytime (or choose a custom one!)
• You can set the decay level of the sounds.
• You can keep …
Play the ocarina, drums, guitar or even trumpets with this app. They are all integrated!
The sound system of this app allows you to set the pitch of a note on the go (Android 3.0+).
More features: • You can enable or disable song recognition (so you can play freely).
• In this app, sounds can be held for about 5 seconds and have a soft decay.
• You can change the background of the app anytime (or choose a custom one!)
• You can set the decay level of the sounds.
• You can keep a note pressed and change its pitch on the go as long as the sound lasts.
• Immersive mode (hiding the navigation bar) available for Android 4.4+ users.
Available instruments: • Ocarina
• Pipes (trumpets)
• Drums
• Guitar
• Harp (BETA, some songs available).
Languages in the app:
• English
• Spanish
• French (Cynthia Soukhavong)
• Italian (Leonardo Zorzi)
• Japanese (Vincent)
Disclaimer:
As stated before, users with an Android version older than 3.0 may not be able to change the pitch (they can't press 2 buttons at the same time since their devices don't support it), but they will be able to play the common notes of an ocarina.
Also, users who have a device with cheap audio hardware may experiment little sound glitches (nothing I can fix), I can only recommend to lower the volume and not to play notes too fast.
Comparable Android apps
The five apps in Entertainment with the closest revenue to Ocarina. Click any to see its detail page.
Each forecast combines App Store rating, ratings count, monetisation model, pricing tier, IAP signals and ad-supported flag.
The base estimate is then multiplied by a per-category scaling factor learned from apps with founder-verified MRR.
Every number on this page comes from public APIs and bumetric's own snapshot history.
Full methodology covers input variables, accuracy bands per category and how we treat apps without comparable anchors.
See also the live data on Ocarina's tracker page for current rating, reviews and snapshot timeline.
Building something similar? Get a free AI audit with $-revenue forecasts for every recommendation.

 Calling Melody
 Страшилки и Ужастики
 Say It Backwards Reverse Audio
 Pure Flix
 Treasure Hunt