This version has 1,818 pages of content!
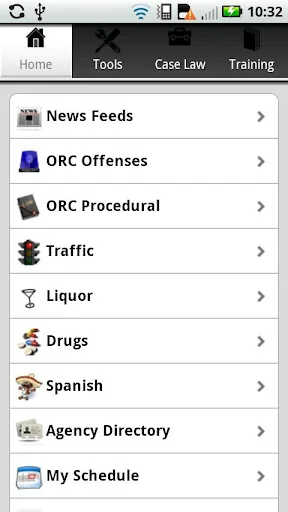
* ORC cheat sheet for traffic offenses; OVI; drug possession; drug trafficking; drug manufacturing; prescription drugs; tobacco; liquor laws; CCW permit holder violations and reciprocity agreements; statute of limitations; Castle Doctrine; ORC definitions (e.g. deadly weapon, offense of violence, etc.); conspiracy, attempt and complicity; degrees of mental culpability; organizational liability.
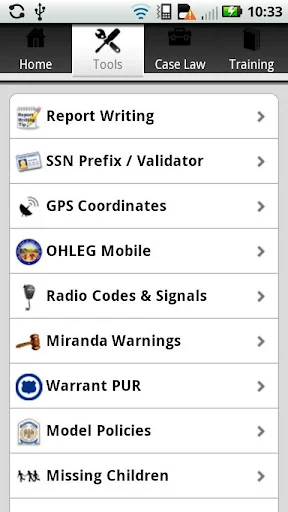
* Accident investigation formulas; brake efficiency; O…
* County number listing; States requiring front license plate; CMV out of service orders & company snapshot.
* Spanish for law enforcement with text translator for other languages
* LiDAR test instructions; Warrant PUR guidelines
* Pill identifier; DEA drug schedule; DEA chemical list; pills of abuse photos; NADDI pharmaceutical drugs of abuse pamphlets; commonly abused prescription drug pics
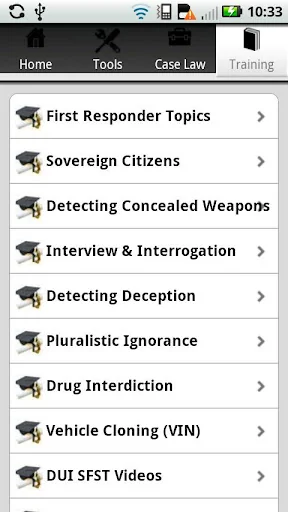
* OVI SFST and new CPR technique video tutorials
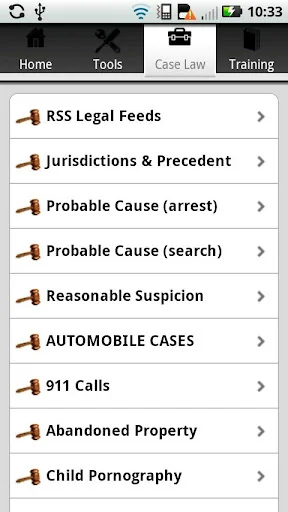
* Case Law resource for probable cause (search); probable cause (arrest); reasonable suspicion; abandoned property; administrative search; community care taking; consent search; corrections (body cavity search; strip search; due process with discipline; prisoner drug testing); disorderly conduct type arrests; exculpatory evidence; exigent circumstances; expectation of privacy; good faith doctrine; hot pursuit; ignorance of law; incident to arrest search; international border searches; internal investigations; K-9 sniffs; Miranda; open fields doctrine; plain view; probationer searches; public authority defense; school searches; stop & frisk; suspect line-Up; thermal camera; traffic stops (pre-textual stops; passenger not free to leave; length of stops; order occupants out of vehicle; passengers to provide identification; miranda warnings; GPS, phone, and beeper pings; vehicle searches; vehicle inventory; roadblock / checkpoints); trash & garbage search; use of force; vehicle pursuits; warrant execution
*Liquor Permit Types; list of active permits (by County); permit violations (by County); and last 500 cancelled permits.
* News RSS feeds from American Police Beat, Officer.com, and PoliceOne.com.
* Legal update RSS feeds from multiple sources.
* Training articles regarding detecting concealed weapons, pluralistic ignorance, interview & interrogation, rookie drug interdiction mistakes, Drug Recognition Expert training, and OVI SFST video tutorials.
* Directory of OPOTC reported municipal police and county sheriff agencies, coroners offices, drug task forces, federal agencies, institutions, OSP posts, prosecutors, and state agencies.
* PDF Cheat Sheets (traffic code, criminal code, CCW, drug trafficking & possession, OVI, money laundering)
* Ohio Attorney General Crime Victims Compensation Program details
Comparable Android apps
The five apps in Education with the closest revenue to Ohio Cop. Click any to see its detail page.
Each forecast combines App Store rating, ratings count, monetisation model, pricing tier, IAP signals and ad-supported flag.
The base estimate is then multiplied by a per-category scaling factor learned from apps with founder-verified MRR.
Every number on this page comes from public APIs and bumetric's own snapshot history.
Full methodology covers input variables, accuracy bands per category and how we treat apps without comparable anchors.
See also the live data on Ohio Cop's tracker page for current rating, reviews and snapshot timeline.
Building something similar? Get a free AI audit with $-revenue forecasts for every recommendation.

 大家學標準日本語:初級本
 Legere Reader
 शिशु विद्यालय
 Sight Words Learning Games & R
 Hands-On Equations Level 1