Oman Oil Marketing is pleased to announce the launch of its new smart Mobile Application on iOS and Android. The app gives you lots of features and rewards to delight your experience at Oman Oil Marketing full network. The app features include:
1. Easy Login.
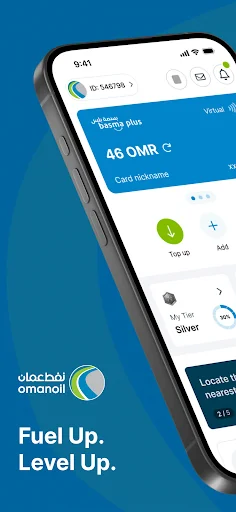
2. Basma Plus fuel cards management.
3. Online Top-up.
4. History and transactions tracker.
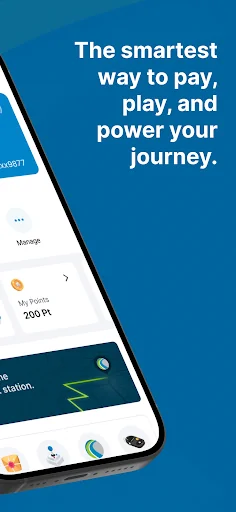
5. Loyalty Points.
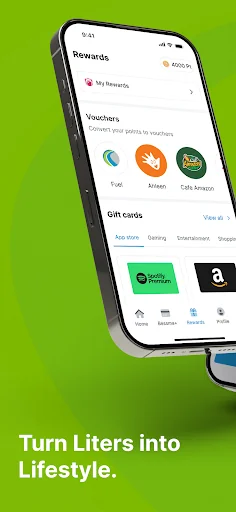
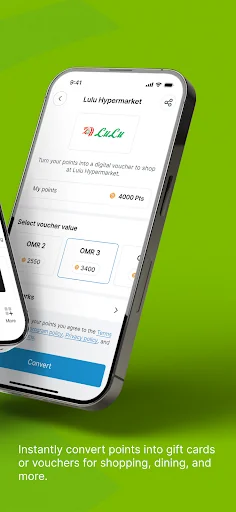
6. eVouchers.
7. Fuel redemption.
8. Advanced Station Locator.
9. Complaints Management System.
10. Station Reviews Sys…
Oman Oil Marketing is pleased to announce the launch of its new smart Mobile Application on iOS and Android. The app gives you lots of features and rewards to delight your experience at Oman Oil Marketing full network. The app features include:
1. Easy Login.
2. Basma Plus fuel cards management.
3. Online Top-up.
4. History and transactions tracker.
5. Loyalty Points.
6. eVouchers.
7. Fuel redemption.
8. Advanced Station Locator.
9. Complaints Management System.
10. Station Reviews System.
To know more visit https://world.oomco.com
Comparable Android apps
The five apps in Business with the closest revenue to omanoil. Click any to see its detail page.
Each forecast combines App Store rating, ratings count, monetisation model, pricing tier, IAP signals and ad-supported flag.
The base estimate is then multiplied by a per-category scaling factor learned from apps with founder-verified MRR.
Every number on this page comes from public APIs and bumetric's own snapshot history.
Full methodology covers input variables, accuracy bands per category and how we treat apps without comparable anchors.
See also the live data on omanoil's tracker page for current rating, reviews and snapshot timeline.
Building something similar? Get a free AI audit with $-revenue forecasts for every recommendation.

 NV Energy
 Hub Driver – Водитель такси
 True Cloud
 Sonetel
 Ivanti Go