The OOLER app is designed to work seamlessly with the OOLER Control Unit.
OOLER, made by Sleepme Inc. and the minds behind the chiliPAD, is the most advanced of its kind to address the frequently overlooked but crucial sleep factor: temperature. OOLER is our most luxurious sleep system, which adjusts your sleeping surface temperature from 55-110°F (13-43°C).
Control Your Sleep Temperature
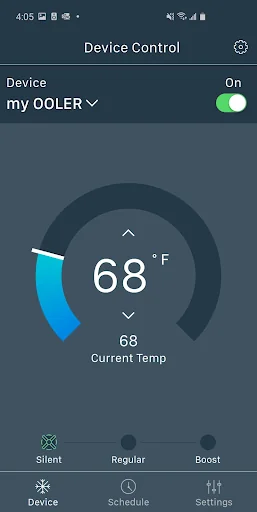
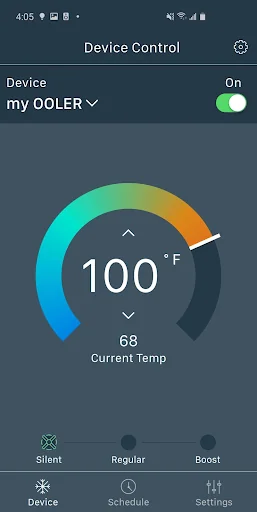
- Increase or decrease your mattress temperature to your desired level
- Select your sleep temperatu…
The OOLER app is designed to work seamlessly with the OOLER Control Unit.
OOLER, made by Sleepme Inc. and the minds behind the chiliPAD, is the most advanced of its kind to address the frequently overlooked but crucial sleep factor: temperature. OOLER is our most luxurious sleep system, which adjusts your sleeping surface temperature from 55-110°F (13-43°C).
Control Your Sleep Temperature
- Increase or decrease your mattress temperature to your desired level
- Select your sleep temperature from 55°-110°F (13°-43°C)
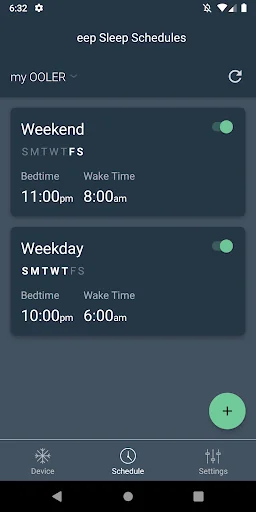
Set Personalized Sleep Schedules
- Enjoy temperature perfection all night long
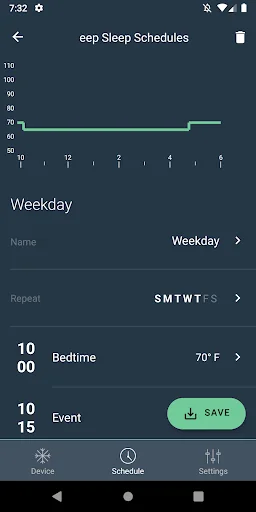
- Set multiple sleep temperatures for the night or week ahead
- Set temperature variations to fall asleep warm and stay asleep cold or anywhere in-between
Improve your Evening & Morning Routine
- Set bedtime reminders to improve your bedtime consistency
- Use the Warm Awake feature as alarm clock replacement. Enjoy waking up with a gentle warming of the mattress temperature to trigger your body’s natural wake response
& More
- Set your desired noise level with Silent, Regular and Boost fan speed modes
Finally, sleep as nature intended with OOLER. Learn more and get yours at chilisleep.com.
Comparable Android apps
The five apps in Health & Fitness with the closest revenue to OOLER. Click any to see its detail page.
Each forecast combines App Store rating, ratings count, monetisation model, pricing tier, IAP signals and ad-supported flag.
The base estimate is then multiplied by a per-category scaling factor learned from apps with founder-verified MRR.
Every number on this page comes from public APIs and bumetric's own snapshot history.
Full methodology covers input variables, accuracy bands per category and how we treat apps without comparable anchors.
See also the live data on OOLER's tracker page for current rating, reviews and snapshot timeline.
Building something similar? Get a free AI audit with $-revenue forecasts for every recommendation.


 Dukan Diet official app
 HIIT Timer, Interval Timer
 Unagrande YogaClub
 Vitalmonitor
 Thrive: Mental Wellbeing