The Ooni app - your ultimate pizza-making companion with a smart dough calculator and Ooni Connect™ Bluetooth connectivity.
Create restaurant-quality pizza at home with Ooni ovens and accessories plus the Ooni app!
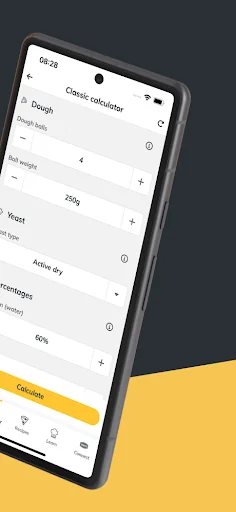
Our smart pizza dough calculator takes the guesswork out of dough making. You can adjust settings for temperature, hydration, yeast type, and proofing time to dial in exactly what you’re looking for.
The app also includes hundreds of delicious recipes and cooking tips. Save y…
The Ooni app - your ultimate pizza-making companion with a smart dough calculator and Ooni Connect™ Bluetooth connectivity.
Create restaurant-quality pizza at home with Ooni ovens and accessories plus the Ooni app!
Our smart pizza dough calculator takes the guesswork out of dough making. You can adjust settings for temperature, hydration, yeast type, and proofing time to dial in exactly what you’re looking for.
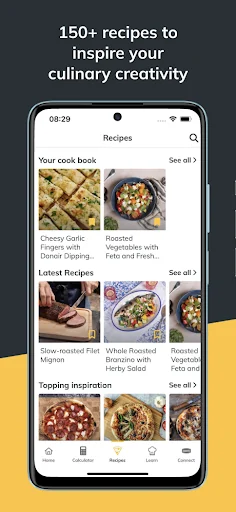
The app also includes hundreds of delicious recipes and cooking tips. Save your favorites and build your personal cookbook.
Plus, you can connect the Ooni app to ovens with Ooni Connect™ via Bluetooth to monitor temperatures remotely in real time.
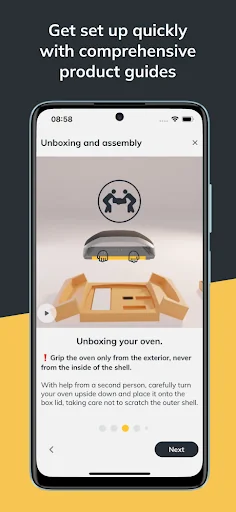
New to Ooni? Our step-by-step guides and resources help you get the hang of pizza-making techniques like stretching dough and launching pies into the oven. Our product guides can also help you take care of your oven and accessories.
If you have questions or feedback, contact apps@ooni.com.
Comparable Android apps
The five apps in Food & Drink with the closest revenue to Ooni. Click any to see its detail page.
Each forecast combines App Store rating, ratings count, monetisation model, pricing tier, IAP signals and ad-supported flag.
The base estimate is then multiplied by a per-category scaling factor learned from apps with founder-verified MRR.
Every number on this page comes from public APIs and bumetric's own snapshot history.
Full methodology covers input variables, accuracy bands per category and how we treat apps without comparable anchors.
See also the live data on Ooni's tracker page for current rating, reviews and snapshot timeline.
Building something similar? Get a free AI audit with $-revenue forecasts for every recommendation.

 UaiRango Admin
 GFoods
 Mensa Göttingen
 Savari Food
 Сицилия