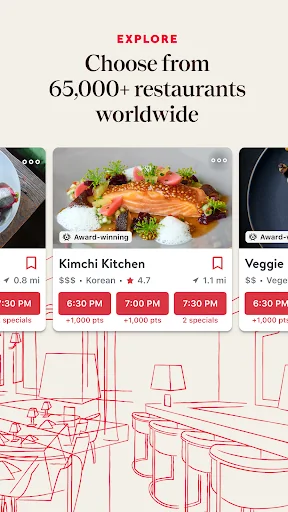
Every great meal starts with OpenTable. OpenTable lets you discover great restaurants where you are. Download the app to explore our network of 65,000+ restaurants worldwide and find the perfect restaurant no matter where life takes you.
<b>Find the perfect table</b>
- Browse new openings, local favorites, and critically acclaimed menus
- Our editorial experts will guide you to the most sought-after restaurants
- Easily filter for cuisine or occasion
- Geo-location helps you find restaur…
Every great meal starts with OpenTable. OpenTable lets you discover great restaurants where you are. Download the app to explore our network of 65,000+ restaurants worldwide and find the perfect restaurant no matter where life takes you.
Find the perfect table - Browse new openings, local favorites, and critically acclaimed menus
- Our editorial experts will guide you to the most sought-after restaurants
- Easily filter for cuisine or occasion
- Geo-location helps you find restaurants when you search “near me”
- Read verified diner reviews to find top-rated restaurants
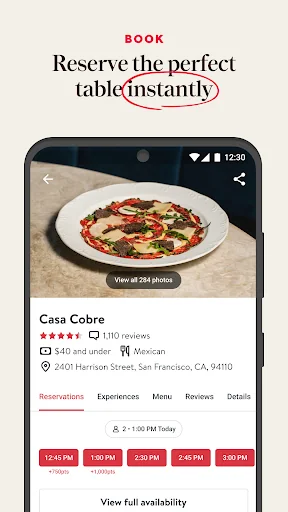
Manage your reservation in one app - Modify reservations from your phone
- Change or cancel your reservation
- Seamlessly increase or decrease your party size
- Get notified when popular tables become available
Get perks for dining - Earn loyalty rewards the more you dine
- Redeem rewards for future reservations
Download OpenTable today to see what makes it Editor’s Choice app, and join the millions of diners who use it to find the perfect restaurant for every occasion.
Follow us on:
https://www.instagram.com/opentable
https://www.tiktok.com/@opentable
https://www.youtube.com/c/OpenTable
https://www.facebook.com/OpenTable/
Need help? We love hearing from you! Reach out at https://help.opentable.com/
Comparable Android apps
The five apps in Food & Drink with the closest revenue to OpenTable. Click any to see its detail page.
Each forecast combines App Store rating, ratings count, monetisation model, pricing tier, IAP signals and ad-supported flag.
The base estimate is then multiplied by a per-category scaling factor learned from apps with founder-verified MRR.
Every number on this page comes from public APIs and bumetric's own snapshot history.
Full methodology covers input variables, accuracy bands per category and how we treat apps without comparable anchors.
See also the live data on OpenTable's tracker page for current rating, reviews and snapshot timeline.
Building something similar? Get a free AI audit with $-revenue forecasts for every recommendation.


 aiqfome: delivery de tudo
 Popeyes®
 Tasty
Tasty
 Yogiyo - Food Delivery
 GrabMerchant