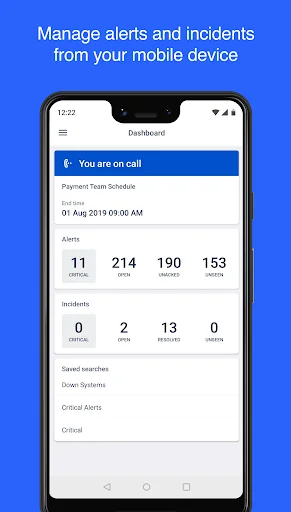
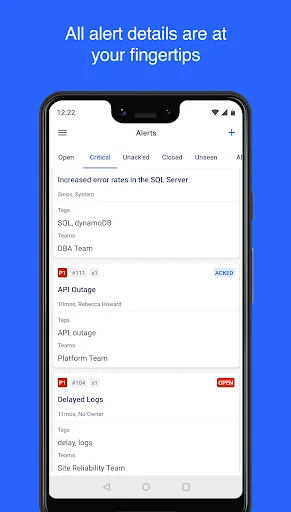
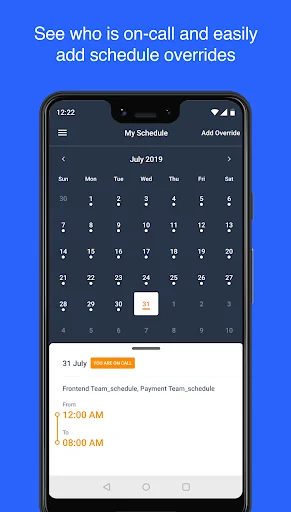
Opsgenie is a modern incident management platform for operating always-on services, empowering Dev & Ops teams to plan for service disruptions and stay in control during incidents. The Opsgenie Application for Android delivers the power of the solution to your mobile devices. You can receive push notifications when alerts and incidents arise, take action directly from the application, understand the status of all known issues and manage your on-call responsibilities.
Opsgenie for Android is f…
Opsgenie is a modern incident management platform for operating always-on services, empowering Dev & Ops teams to plan for service disruptions and stay in control during incidents. The Opsgenie Application for Android delivers the power of the solution to your mobile devices. You can receive push notifications when alerts and incidents arise, take action directly from the application, understand the status of all known issues and manage your on-call responsibilities.
Opsgenie for Android is free for all Opsgenie customers and requires a subscription to Opsgenie service. Your Opsgenie administrator will send an invite via email for you to create an account. Once your account is created, you can log in to Opsgenie service from the Android app with your Opsgenie username and password.
You can view additional documentation at https://docs.opsgenie.com/docs/android-app
Features:
* Customizable dashboards for responding to alerts and incidents faster
* Ability to create alerts and incidents with ease
* Easy access and response to alerts and incidents (Acknowledge, Close, Escalate to Next, Take Ownership, Snooze and many more)
* Ability to execute custom actions on alerts and incidents (i.e ping, restart server, …)
* Opsgenie-hosted audio & video conferencing (Incident Command Center) to effectively collaborate during incidents
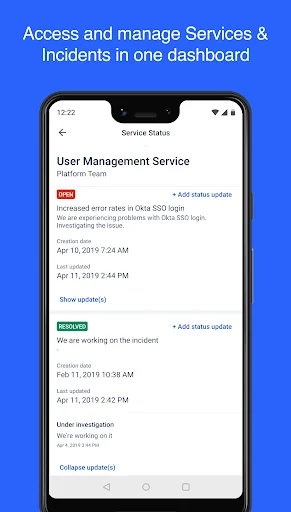
* Service Catalogs to identify and manage service units
* Ability to track each service’s status via dedicated status pages
* Ability to define & add responders and/or stakeholders to incidents
* Ability to select multiple alerts/incidents and execute an action for all
* Ability to save and reuse the searches previously defined in order to filter alerts and incidents
* Who Is On-Call page which enables viewing all schedules and active rotations of the moment
* User Directory that enables accessing all users and their contact information
* Ability to easily contact users via phone call, SMS, email, and Skype
* Ability to mute/unmute notifications
* Ability to enable/disable notification preferences, notification rules and contact methods
Comparable Android apps
The five apps in Tools with the closest revenue to Opsgenie. Click any to see its detail page.
Each forecast combines App Store rating, ratings count, monetisation model, pricing tier, IAP signals and ad-supported flag.
The base estimate is then multiplied by a per-category scaling factor learned from apps with founder-verified MRR.
Every number on this page comes from public APIs and bumetric's own snapshot history.
Full methodology covers input variables, accuracy bands per category and how we treat apps without comparable anchors.
See also the live data on Opsgenie's tracker page for current rating, reviews and snapshot timeline.
Building something similar? Get a free AI audit with $-revenue forecasts for every recommendation.

 Goals Theocratic
 Safe Gallery: Photo Vault
 Key Mapper & Floating Buttons
 GPS altimeter
 Mambo Cecotec