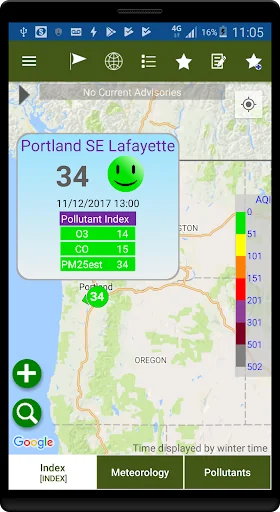
***The data displayed in this application was acquired from air quality monitoring stations operated by Oregon Department of Environmental Quality and Lane Regional Air Protection Agency.
***The data displayed are the most current available.
***All readings are preliminary and subject to change during final review.
***New AQI readings will be available at approximately 15-20 minutes past the hour.
***Any questions can be directed to AQM.Questions@deq.state.or.us.
This application wa…
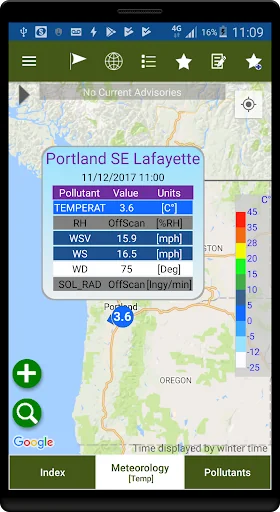
***The data displayed in this application was acquired from air quality monitoring stations operated by Oregon Department of Environmental Quality and Lane Regional Air Protection Agency.
***The data displayed are the most current available.
***All readings are preliminary and subject to change during final review.
***New AQI readings will be available at approximately 15-20 minutes past the hour.
***Any questions can be directed to AQM.Questions@deq.state.or.us.
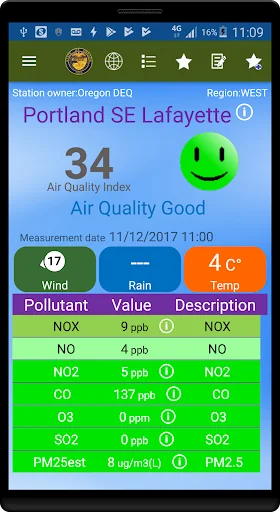
This application was developed for OregonDEQ in conjunction with DR DAS LTD and Envitech Ltd.
Comparable Android apps
The five apps in Weather with the closest revenue to OregonAIR. Click any to see its detail page.
Each forecast combines App Store rating, ratings count, monetisation model, pricing tier, IAP signals and ad-supported flag.
The base estimate is then multiplied by a per-category scaling factor learned from apps with founder-verified MRR.
Every number on this page comes from public APIs and bumetric's own snapshot history.
Full methodology covers input variables, accuracy bands per category and how we treat apps without comparable anchors.
See also the live data on OregonAIR's tracker page for current rating, reviews and snapshot timeline.
Building something similar? Get a free AI audit with $-revenue forecasts for every recommendation.

 South Africa Weather
 TT Met Office
 Senegal Weather
 Fire Danger Outdoors
 FPS Survival Gun Shooting Game