ML revenue forecast.
Calibrated against 24961 apps in this category.
Confidence band
±15%
High — many comparable apps with verified data
At a glance
Tracks close to the Android app category median (181/mo).
Ranks #13,346 of 24,961 in Sports (top 53.5% by revenue).
Launched Nov 19, 2019 · last updated Aug 24, 2025.
What the app looks like
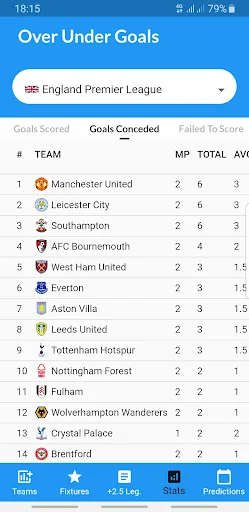
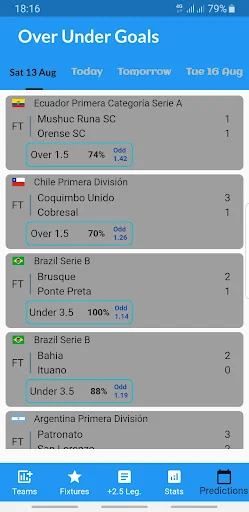
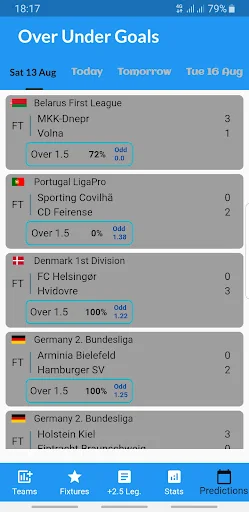
Live screenshots from the Play Store, captured by our snapshot worker. Tap any image to enlarge.
Over Under Goals's revenue trajectory
Forecast revenue from snapshot history. Last 1 months.
Where Over Under Goals sits in Sports
Revenue distribution of 24961 comparable apps. Over Under Goals highlighted.
Over Under Goals vs comparable apps
Revenue trajectory side-by-side. Bold = Over Under Goals, ghosted = peers.
App spec
Version
5.0.3
Last update
Aug 24, 2025
Launched
Nov 19, 2019
Price
Free
Monetization
Free
What Over Under Goals actually does (from store listing)
Our football over and under goals tips are one of a kind in the football betting space.
Our betting experts, combined with modern predictive machine learning models give you more options like total goals, away or home over and under goal.
***Football Leagues***
- CHAMPIONS LEAGUE
- EUROPE LEAGUE
- BELGIUM: Jupiler League, Proximus League
- GERMANY: Bundesliga, 2.Bundesliga, 3.Liga
- NETHERLANDS: Eredivisie, Eerste divisie
- FRANCE: Ligue 1, Ligue 2, National, National 2
- GREECE…
Our football over and under goals tips are one of a kind in the football betting space.
Our betting experts, combined with modern predictive machine learning models give you more options like total goals, away or home over and under goal.
***Football Leagues***
- CHAMPIONS LEAGUE
- EUROPE LEAGUE
- BELGIUM: Jupiler League, Proximus League
- GERMANY: Bundesliga, 2.Bundesliga, 3.Liga
- NETHERLANDS: Eredivisie, Eerste divisie
- FRANCE: Ligue 1, Ligue 2, National, National 2
- GREECE: Super League, Football League
- ENGLAND: Premier League, Championship, League One, League Two, Vanarama National League, FA Cup
- ITALY: Serie A, Serie B, Serie C, Tim Cup
- PORTUGAL: Primeira Liga, Segunda Liga
- SPAIN: LaLiga, LaLiga 2, Segunda Division B
- SCOTLAND: Premiership, Championship, League One, League Two
- TURKEY: SuperLiga, 1.Lig
-and many more.
https://www.begambleaware.org
Comparable Android apps
The five apps in Sports with the closest revenue to Over Under Goals. Click any to see its detail page.
Each forecast combines App Store rating, ratings count, monetisation model, pricing tier, IAP signals and ad-supported flag.
The base estimate is then multiplied by a per-category scaling factor learned from apps with founder-verified MRR.
Every number on this page comes from public APIs and Bumetric's own snapshot history.
Full methodology covers input variables, accuracy bands per category and how we treat apps without comparable anchors.
See also the live data on Over Under Goals's tracker page for current rating, reviews and snapshot timeline.
Building something similar? Get a free AI audit with $-revenue forecasts for every recommendation.



 Pocket Radar® Sports
 Scarlet Knights
 CricSync: The Best Scoring App
 DogFight Golf
 CapoeiraPedia Lite