What Pajama Sam 3 actually does (from store listing)
Pajama Sam 3: You Are What You Eat From Your Head To Your Feet
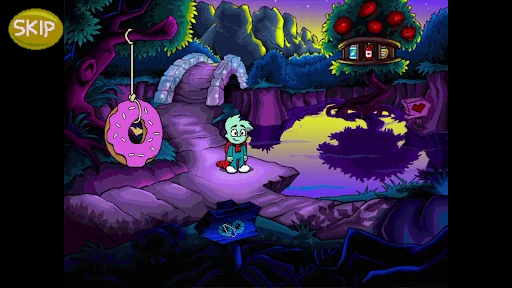
Pajama Sam is off on a nutritiously edible adventure!
Pajama Sam chases down some snickering cookies, only to find himself in the midst of a food squabble! The fats and the sweets are taking over Mop Top Island and an emergency peace conference has been called, but four of the delegates are missing! Now, it's your turn to spring into action to help Pajama Sam find the missing delegates, put a stop to the sticky quarrels, bring…
Pajama Sam 3: You Are What You Eat From Your Head To Your Feet
Pajama Sam is off on a nutritiously edible adventure!
Pajama Sam chases down some snickering cookies, only to find himself in the midst of a food squabble! The fats and the sweets are taking over Mop Top Island and an emergency peace conference has been called, but four of the delegates are missing! Now, it's your turn to spring into action to help Pajama Sam find the missing delegates, put a stop to the sticky quarrels, bring peace to Mop Top Island, and still make it home in time for dinner.
FEATURES:
• Meet friends along the way - friendly food walks, talks and even tell jokes.
• Explore and Learn: Investigate every location. There is something new to learn with every click!
• Interact with the characters and listen closely for clues.
• It's a different game each time you play.
Comparable Android apps
The five apps in Casual with the closest revenue to Pajama Sam 3. Click any to see its detail page.
Each forecast combines App Store rating, ratings count, monetisation model, pricing tier, IAP signals and ad-supported flag.
The base estimate is then multiplied by a per-category scaling factor learned from apps with founder-verified MRR.
Every number on this page comes from public APIs and bumetric's own snapshot history.
Full methodology covers input variables, accuracy bands per category and how we treat apps without comparable anchors.
See also the live data on Pajama Sam 3's tracker page for current rating, reviews and snapshot timeline.
Building something similar? Get a free AI audit with $-revenue forecasts for every recommendation.


 iFMS
iFMS
 Level Booster Pro
 HappyFish
 sand:box
 Lunch Rush HD (Full)