What Panini Direct actually does (from store listing)
Panini Direct – Trading Cards & Memorabilia
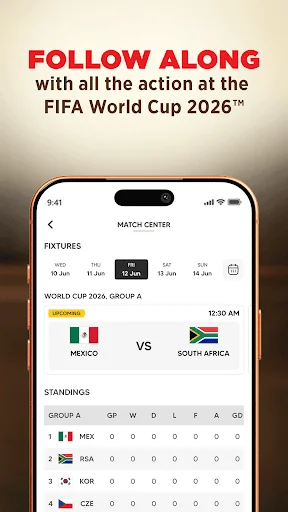
The rush of the rip stays a tap away, and the world of collecting fits into your pocket with the Panini Direct app.
Trading Cards
Who Do You Collect? There’s no wrong answer, and Panini has collectors set in any condition. With officially licensed cards from the FIFA, WNBA, NASCAR, LALIGA, NWSL, SERIE A, LIV Golf, EUROLEAGUE, UNFP, and select NIL Colleges, there’s something for everyone.
Panini Instant
The fastest cards in the game. Ins…
The rush of the rip stays a tap away, and the world of collecting fits into your pocket with the Panini Direct app.
Trading Cards
Who Do You Collect? There’s no wrong answer, and Panini has collectors set in any condition. With officially licensed cards from the FIFA, WNBA, NASCAR, LALIGA, NWSL, SERIE A, LIV Golf, EUROLEAGUE, UNFP, and select NIL Colleges, there’s something for everyone.
Panini Instant
The fastest cards in the game. Instant turns must-see moments and major milestones into ready-to-purchase cards as they happen. Not only fast, but fantastic too, Instant cards can feature autographs and vibrant numbered parallels.
Exclusive Memorabilia
Supplement your card collection with a jaw-dropping piece of memorabilia from Panini Authentic. This includes autographed balls, jerseys, helmets and photos from some of sport’s biggest names.
Why Panini Direct?
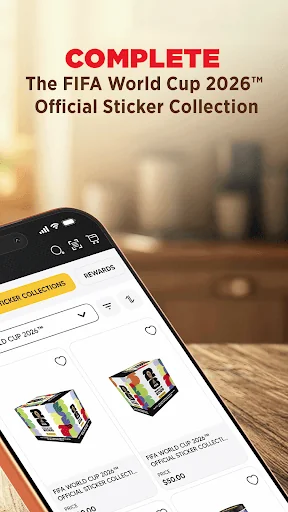
Easily shop must-have Panini releases, including FOTL and hobby boxes
Collect Panini Instant cards of the world’s freshest highlights
Secure authentic memorabilia that can headline any collection
Customize your search by team, player or sport
Who Do You Collect? #WhoDoYouCollect
Follow Panini America for product updates, exclusive releases, and behind-the-scenes
looks into the world of collecting:
Each forecast combines App Store rating, ratings count, monetisation model, pricing tier, IAP signals and ad-supported flag.
The base estimate is then multiplied by a per-category scaling factor learned from apps with founder-verified MRR.
Every number on this page comes from public APIs and bumetric's own snapshot history.
Full methodology covers input variables, accuracy bands per category and how we treat apps without comparable anchors.
See also the live data on Panini Direct's tracker page for current rating, reviews and snapshot timeline.
Building something similar? Get a free AI audit with $-revenue forecasts for every recommendation.
 Billiards - 3 Balls
 Disc Golf Network
 versus 16P
 BWF Shuttle Time
 Everton