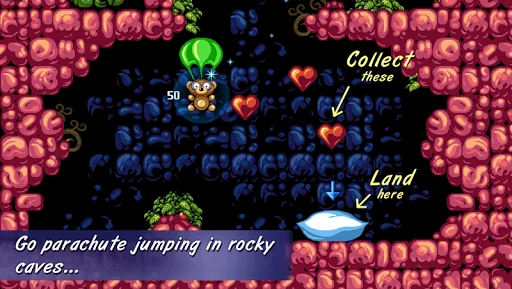
It's time to go parachuting, Teddy style!
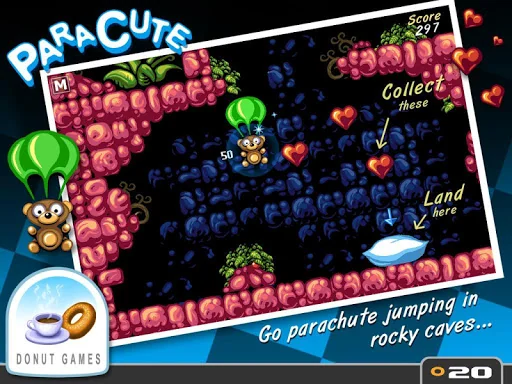
Jump down the rocky caves of Fuzzy Land and aim for the fluffy pillow at the bottom of each cave. Try collecting as many bonus items as possible without snapping the chute.
But beware! Rumor has it that these caves are full of Electro-Cuties, angry blobs or other weird, crazy cave creatures. But those are just rumors... right?
* * * * * * * * * * * * * * * * * * * * * * * *
GAME FEATURES:
- Adorable retro style pixel graphics
- 40 Caves t…
Jump down the rocky caves of Fuzzy Land and aim for the fluffy pillow at the bottom of each cave. Try collecting as many bonus items as possible without snapping the chute.
But beware! Rumor has it that these caves are full of Electro-Cuties, angry blobs or other weird, crazy cave creatures. But those are just rumors... right?
* * * * * * * * * * * * * * * * * * * * * * * *
GAME FEATURES:
- Adorable retro style pixel graphics
- 40 Caves to explore*
- Donut Games' famous 3-Star ranking system for improved replay value
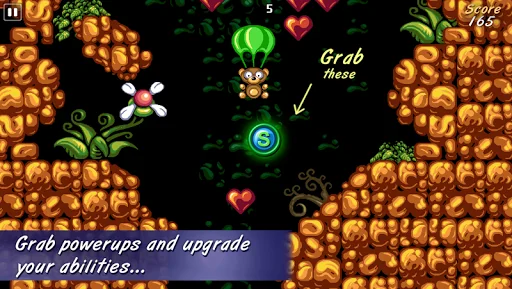
- Glide through caves filled with power-ups and bonus items
- Use switches & teleporters to reach hidden areas
- And much more...
* Paracute is free from ads and playable at no cost. The first 5 levels are available for everyone.
A premium upgrade is provided as an optional one-time in-app purchase, for anyone who'd like to add more levels.
We believe in a fair pricing policy: Pay once, own forever!
* * * * * * * * * * * * * * * * * * * * * * * *
Enjoy another Donut Games release!
Comparable Android apps
The five apps in Arcade with the closest revenue to Paracute. Click any to see its detail page.
Each forecast combines App Store rating, ratings count, monetisation model, pricing tier, IAP signals and ad-supported flag.
The base estimate is then multiplied by a per-category scaling factor learned from apps with founder-verified MRR.
Every number on this page comes from public APIs and bumetric's own snapshot history.
Full methodology covers input variables, accuracy bands per category and how we treat apps without comparable anchors.
See also the live data on Paracute's tracker page for current rating, reviews and snapshot timeline.
Building something similar? Get a free AI audit with $-revenue forecasts for every recommendation.


 Flank That Tank!
 Moon Patrol Run
 Dodge Arrow!
 My Last 20: Survive for 20s
 Stickman Jetpack Challenge