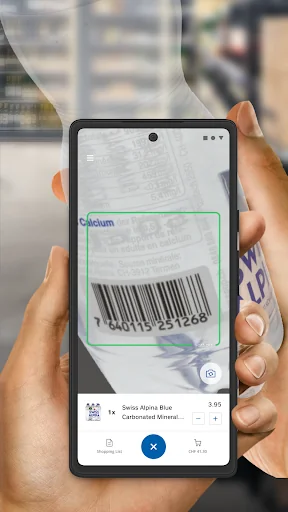
Thanks to Passabene, you can scan your shopping directly on the shelf in any Coop supermarket in Switzerland and put it straight into your shopping bag. This means your shopping is already scanned and ready for payment at the checkout.
With the passabene app, you use your smartphone rather than a hand scanner from the store.
Your advantages:
- Passabene is easy to use:
You scan the items yourself and put them in your shopping bag.
- You always have an overview:
With passabene you can…
Thanks to Passabene, you can scan your shopping directly on the shelf in any Coop supermarket in Switzerland and put it straight into your shopping bag. This means your shopping is already scanned and ready for payment at the checkout.
With the passabene app, you use your smartphone rather than a hand scanner from the store.
Your advantages:
- Passabene is easy to use:
You scan the items yourself and put them in your shopping bag.
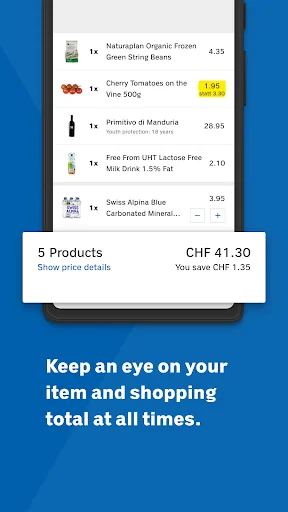
- You always have an overview:
With passabene you can always see your chosen items and the total amount.
- You save time:
You don’t have to place your shopping on the conveyor belt. Only the completion code on your smartphone is scanned at the checkout or self-checkout.
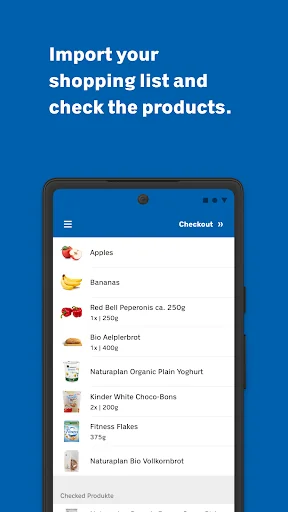
How passabene works:
1. Install the app
2. Log in with your Supercard ID or create a new Supercard ID
3. Select the store using location services or by scanning a QR code
4. Scan item
5. Pay for your shopping at a checkout of your choice
Further information: www.coop.ch/passabene
Important:
A stable Internet connection (3G or faster) is required to use the passabene app.
Free Wi-Fi is available in all Coop stores, which you can use as an alternative to your mobile phone network.
Please note that you may incur charges from your provider when using the mobile phone network.
For more information about Coop’s free Wi-Fi go to: www.coop.ch/wifi
Supercard and digital advantages
When you use passabene you don’t have to show your Supercard at the checkout.
Digital coupons and collection passes are automatically taken into account when you shop. Your Superpoints are credited automatically after payment.
For detailed information go to: https://www.supercard.ch/de/app-digitale-services.html
Problems during use
If you have any questions or problems, please contact our Customer Service.
Tel. 0848 880 440 (national rate: CHF 0.08/min.)
Monday to Saturday, 8 a.m. to 8 p.m.
www.coop.ch/en/company/contact.html
Comparable Android apps
The five apps in Shopping with the closest revenue to passabene. Click any to see its detail page.
Each forecast combines App Store rating, ratings count, monetisation model, pricing tier, IAP signals and ad-supported flag.
The base estimate is then multiplied by a per-category scaling factor learned from apps with founder-verified MRR.
Every number on this page comes from public APIs and bumetric's own snapshot history.
Full methodology covers input variables, accuracy bands per category and how we treat apps without comparable anchors.
See also the live data on passabene's tracker page for current rating, reviews and snapshot timeline.
Building something similar? Get a free AI audit with $-revenue forecasts for every recommendation.


 白鳥麗子人氣女鞋第一品牌
 Natcom TopUp
 Avion Rewards
 JAMEIA.COM
 ShopWSS