Exclusive access to your favorite creators and communities from anywhere.
Patreon is where you can access exclusive podcasts, videos, art, writing, recipes, courses, music, and more from your favorite creators, and build community with both the creators you love and other fans.
When you join a creator’s Patreon, you unlock access to a world of exclusive posts, a community group chat, and more. Here’s how you can use the Patreon app to make your experience even better:
ACCESS exclu…
Exclusive access to your favorite creators and communities from anywhere.
Patreon is where you can access exclusive podcasts, videos, art, writing, recipes, courses, music, and more from your favorite creators, and build community with both the creators you love and other fans.
When you join a creator’s Patreon, you unlock access to a world of exclusive posts, a community group chat, and more. Here’s how you can use the Patreon app to make your experience even better:
ACCESS exclusive work from your favorite creators in seconds, from sneak peeks and bonus episodes to demo tracks and behind-the-scenes looks.
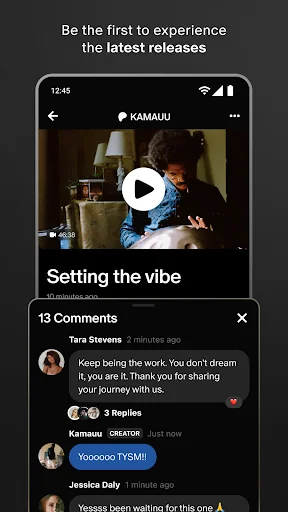
JOIN the conversation in community group chats, where you can engage directly with creators and other fans in an intimate space outside of the comments section.
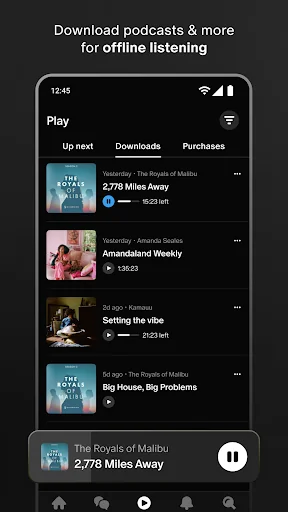
DOWNLOAD podcasts, music, and other audio for easy offline listening.
BE the first to experience the latest releases from creators you love.
IMMERSE yourself in creators’ worlds, where their work is grouped and displayed in easy-to-navigate collections.
GET to know other fans and let other fans get to know you through personalized fan profiles.
Comparable Android apps
The five apps in Entertainment with the closest revenue to Patreon. Click any to see its detail page.
Each forecast combines App Store rating, ratings count, monetisation model, pricing tier, IAP signals and ad-supported flag.
The base estimate is then multiplied by a per-category scaling factor learned from apps with founder-verified MRR.
Every number on this page comes from public APIs and bumetric's own snapshot history.
Full methodology covers input variables, accuracy bands per category and how we treat apps without comparable anchors.
See also the live data on Patreon's tracker page for current rating, reviews and snapshot timeline.
Building something similar? Get a free AI audit with $-revenue forecasts for every recommendation.


 App Flame: Play & Earn
 Mommy Saver Plus
 Good morning, love images
 Cineplanet Perú
 The CW