The Power & Energy Logger (PEL) app enables you to work with your Chauvin-Arnoux Power & Energy Logger Models 102, 103, and 105 instruments from an Android device. These instruments provide all the necessary functions for power and energy data logging for most 50Hz, 60Hz, 400Hz, and DC electrical distribution systems.
With the Power & Energy Logger app, you can:
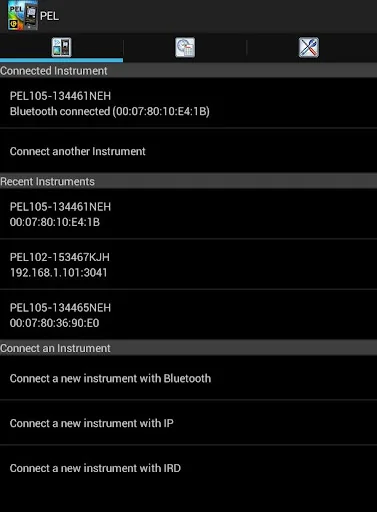
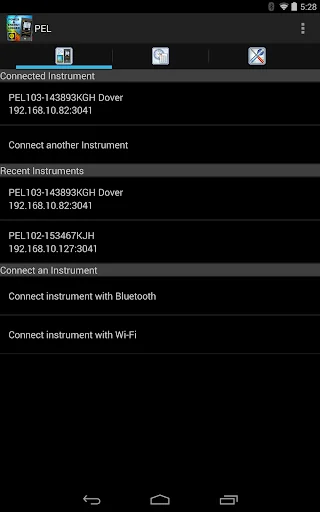
- Connect your Android device to a PEL instrument using a Bluetooth, IP network, or (for the PEL 105) IRD server connection.
…
The Power & Energy Logger (PEL) app enables you to work with your Chauvin-Arnoux Power & Energy Logger Models 102, 103, and 105 instruments from an Android device. These instruments provide all the necessary functions for power and energy data logging for most 50Hz, 60Hz, 400Hz, and DC electrical distribution systems.
With the Power & Energy Logger app, you can:
- Connect your Android device to a PEL instrument using a Bluetooth, IP network, or (for the PEL 105) IRD server connection.
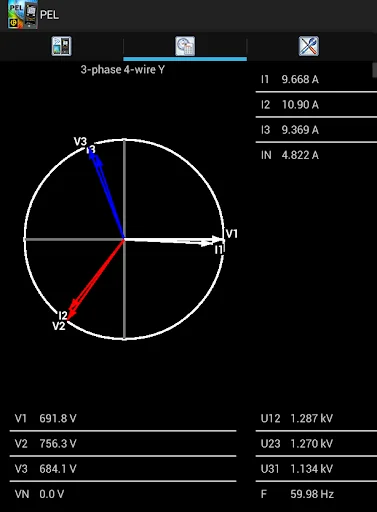
- View data currently being measured by the instrument in real-time. This includes the type of distribution system (electrical setup), and (for AC systems) the phasor diagram appropriate for that setup. Real-time data is organized in tables of related measurements for quick navigation and reference, and updated continuously from the instrument.
- Schedule and stop a recording session on the PEL. This can be a recording that starts immediately, or at a future date and time. You can also choose which data to record. The recorded data is stored on the PEL instrument; it can subsequently be downloaded to a PC and analyzed in detail using Chauvin-Arnoux's DataView data analysis software.
- View and/or set configuration variables on the PEL instrument. You can change the type of distribution system being measured, voltage ratios, nominal frequency, current sensors options, communication-related settings, and other information related to the instrument and its operation.
The Power & Energy Logger app provides a quick, convenient, and mobile option for working with a PEL instrument. It provides a substantial subset of the features and functionality offered in DataView, without requiring a PC. And it allows you to easily connect to PEL instruments that may be placed in hard-to-access locations.
Comparable Android apps
The five apps in Tools with the closest revenue to PEL. Click any to see its detail page.
Each forecast combines App Store rating, ratings count, monetisation model, pricing tier, IAP signals and ad-supported flag.
The base estimate is then multiplied by a per-category scaling factor learned from apps with founder-verified MRR.
Every number on this page comes from public APIs and Bumetric's own snapshot history.
Full methodology covers input variables, accuracy bands per category and how we treat apps without comparable anchors.
See also the live data on PEL's tracker page for current rating, reviews and snapshot timeline.
Building something similar? Get a free AI audit with $-revenue forecasts for every recommendation.



 Comelit IP 100
 ProductSecure - Product Secure
 Where is? - My location is...
 Inville
 Luminus