- 1 octave to 8 octave
- Volume envelope
- Sweep control (pitch shift)
- Wavetable are editable
==========
Keyboard
==========
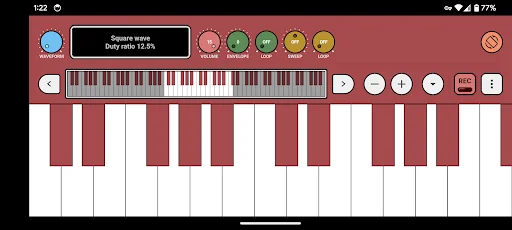
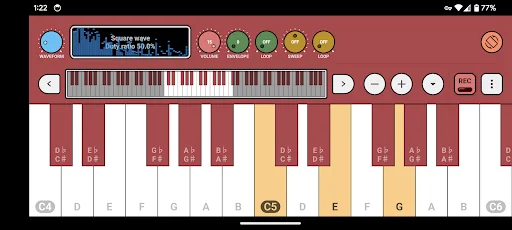
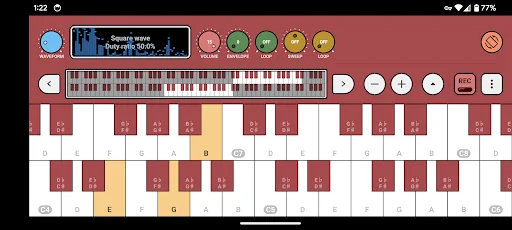
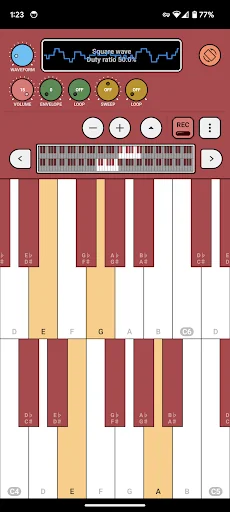
- 96 keys
- Rows: 1 row or 2 rows
- Width: 1 octave up to 8 octaves
==========
Recording
==========
- WAVE file format
==========
Connection with
MIDI devices
==========
Supports MIDI keyboard (USB and Bluetooth LE)
* Bluetooth connection requires that your Android device supports Bluetooth Low Energy (Bluetooth 4.0 or later).
==========
Note
==========
For Android 9 and lower, storage write and read permissions are required for recording, file operations, and reading. These permissions are not used for any other purpose.
For Android 11 and lower, location permission are required to search for Bluetooth devices. This permission are not used for any other purpose.
==========
Knob
==========
Tap: 1 step
Touch and Move: Adjust
Comparable Android apps
The five apps in Music & Audio with the closest revenue to Piconica. Click any to see its detail page.
Each forecast combines App Store rating, ratings count, monetisation model, pricing tier, IAP signals and ad-supported flag.
The base estimate is then multiplied by a per-category scaling factor learned from apps with founder-verified MRR.
Every number on this page comes from public APIs and bumetric's own snapshot history.
Full methodology covers input variables, accuracy bands per category and how we treat apps without comparable anchors.
See also the live data on Piconica's tracker page for current rating, reviews and snapshot timeline.
Building something similar? Get a free AI audit with $-revenue forecasts for every recommendation.


 Plexamp
 اناشيد ماهر زين بدون نت 2025
 Web Radio Fraternidade
 Quick Song Editor
 Kerrang! Radio