What Pixels of Fortnite actually does (from store listing)
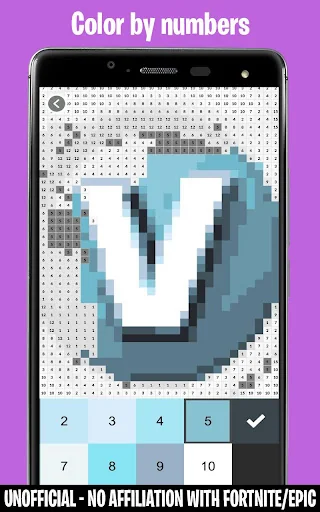
🔥Coloring by numbers Game with Fortnite themed images🔥
Want to enjoy some pixel coloring with images from your favorite game, Fortnite? Look no futher!
Plenty of images to color, all manually pixelated to improve your coloring experience.
Can you finish all the pictures?
Features:
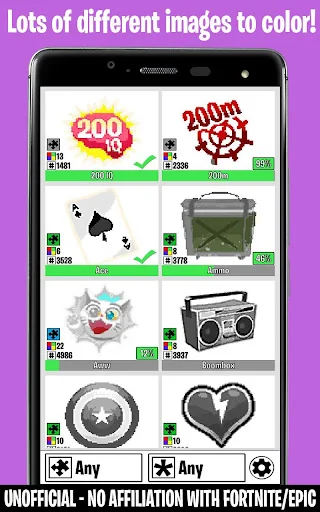
★Lots of images to color, all themed to the Fortnite game
★Color in your own pace, no timers, just relax!
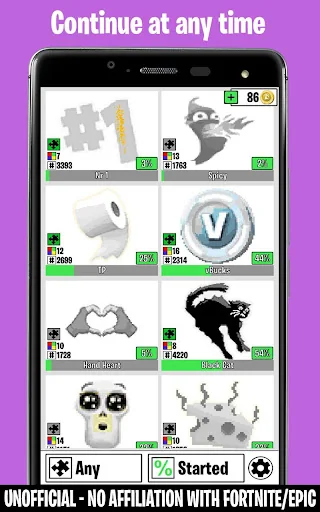
★Save and continue your progress at any time
★Power Ups available to speed up coloring
★Easy to pla…
🔥Coloring by numbers Game with Fortnite themed images🔥
Want to enjoy some pixel coloring with images from your favorite game, Fortnite? Look no futher!
Plenty of images to color, all manually pixelated to improve your coloring experience.
Can you finish all the pictures?
Features:
★Lots of images to color, all themed to the Fortnite game
★Color in your own pace, no timers, just relax!
★Save and continue your progress at any time
★Power Ups available to speed up coloring
★Easy to play game, simple controls, tap to color, or hold to color multiple in a row
Content Creator Tag: Gnejs
Use the tag in Fortnite or the Epic Games Store to support us.
We are an Epic Games partner, part of the revenue is shared with us if you use the code.
Thanks for your support!
This is an Unofficial Fortnite App and has NO affiliation with Epic Games™
This App is adhering to the Fan Content Policy created by Epic Portions of the materials used are trademarks and/or copyrighted works of Epic Games, Inc. All rights reserved by Epic. This material is not official and is not endorsed by Epic.
Policy URL: https://www.epicgames.com/site/en-US/fan-art-policy
This App does NOT contain any purchases of any kind, as required by the policies.
Legal Notice Epic Games, Inc. Epic, Epic Games, the Epic Games logo, Fortnite and the Fortnite logo are trademarks or registered trademarks of Epic Games, Inc. in the United States of America and elsewhere. All rights reserved.
Comparable Android apps
The five apps in Casual with the closest revenue to Pixels of Fortnite. Click any to see its detail page.
Each forecast combines App Store rating, ratings count, monetisation model, pricing tier, IAP signals and ad-supported flag.
The base estimate is then multiplied by a per-category scaling factor learned from apps with founder-verified MRR.
Every number on this page comes from public APIs and bumetric's own snapshot history.
Full methodology covers input variables, accuracy bands per category and how we treat apps without comparable anchors.
See also the live data on Pixels of Fortnite's tracker page for current rating, reviews and snapshot timeline.
Building something similar? Get a free AI audit with $-revenue forecasts for every recommendation.

 Brain Crush
 Princess Back Spa
 Gift Clicker
 Iron It
 Water Ripples Wallpapers