How much does Solar Walk 2 - View Planets 3D earn?
iOS app
from Vito Technology Inc.
· News
ML forecast★ 4.7 · 7K→ StablePaid
~9.1K/mo
ML revenue forecast.
Calibrated against 2508 apps in this category.
Confidence band
±15%
High — many comparable apps with verified data
At a glance
Earns 9.17× more than the category median (988/mo).
Ranks #100 of 2,508 in News (top 4.0% by revenue).
Launched Sep 24, 2015 · last updated Dec 28, 2023.
24 months of snapshot history tracked.
What the app looks like
Live screenshots from the App Store, captured by our snapshot worker. Tap any image to enlarge.
Solar Walk 2 - View Planets 3D's revenue trajectory
Forecast revenue from snapshot history. Last 24 months.
Where Solar Walk 2 - View Planets 3D sits in News
Revenue distribution of 2508 comparable apps. Solar Walk 2 - View Planets 3D highlighted.
Solar Walk 2 - View Planets 3D vs comparable apps
Revenue trajectory side-by-side. Bold = Solar Walk 2 - View Planets 3D, ghosted = peers.
App spec
Version
1.6.7
Last update
Dec 28, 2023
Launched
Sep 24, 2015
Min OS
12.0
Rating
4+
Price
$2.99
Monetization
Paid
Languages
NL, EN, FR, DE +9
What Solar Walk 2 - View Planets 3D actually does (from App Store listing)
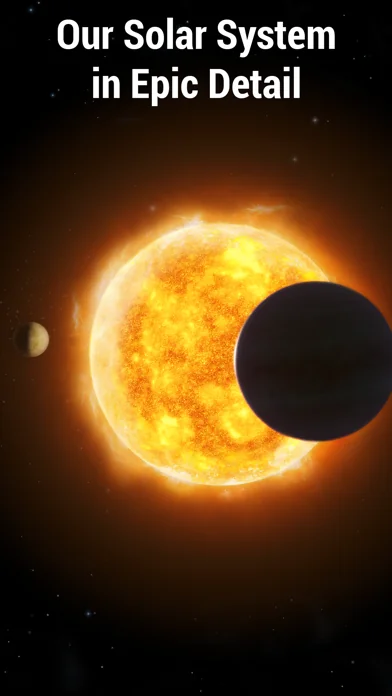
Solar Walk 2 is a powerful tool for exploring our Solar system. The app takes you on a fascinating trip through the vast realms of space and introduces an amazing Solar system model with beautiful 3D representations of the Sun, the Moon, planets, satellites, planetary atmospheres and other space objects in the smallest details.
Being a new way to view the Solar system and explore the most outstanding space missions, Solar Walk 2 stands out among other astronomy applications with its stunning vi…
Solar Walk 2 is a powerful tool for exploring our Solar system. The app takes you on a fascinating trip through the vast realms of space and introduces an amazing Solar system model with beautiful 3D representations of the Sun, the Moon, planets, satellites, planetary atmospheres and other space objects in the smallest details.
Being a new way to view the Solar system and explore the most outstanding space missions, Solar Walk 2 stands out among other astronomy applications with its stunning visuals, graphics and attractive interface.
*** Best of 2016 ***
"A must-have for solar system enthusiasts." - Star Mapping
"The application is entertaining and useful as an astronomy educational tool." - MyMac
"A great way for users of any age to learn more about astronomy." - AppAdvice
"A peerless educational tool in astronomy boasting dazzling 3D visuals of solar flares, planetary atmospheres, auroras, and asteroid belts to deliver a unique space experience with unprecedented authenticity." - Appolicious
Main features:
● 3D model of our Solar system ● Interactive space encyclopedia ● Astronomy calendar with various celestial events ● Travel in time and space ● Space missions and the history of space exploration ● Fantastic 3D models of spacecraft ● 360 degree images - panoramic photos of our Solar system ● "What's new" section with the latest news from the world of space and astronomy
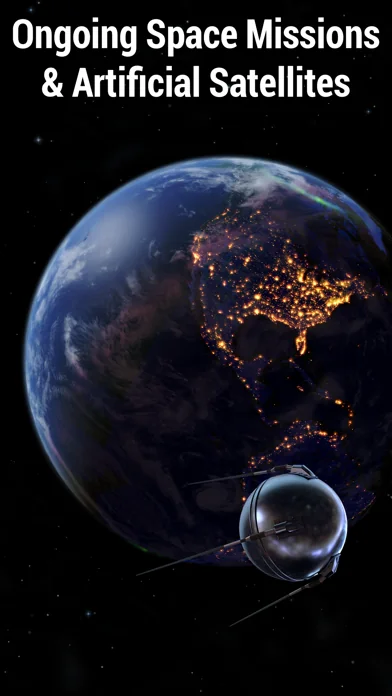
► With Solar Walk 2 you will be able to see highly-elaborated and realistic 3D models of spacecraft, satellites and interplanetary stations in real action. You will see where they started, track the real trajectory of their flight path, watch gravitational maneuvers, view real pictures made during the missions.
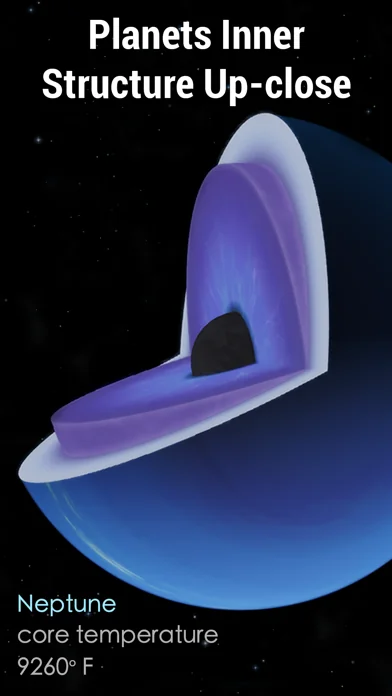
► Enjoy observing fascinating 3D representations of Solar system objects and various deep space objects. The list is growing! We’re eager to add new dwarf planets, missions and more facts about space! All celestial bodies are represented in their correct positions in real time and provided with the detailed information.
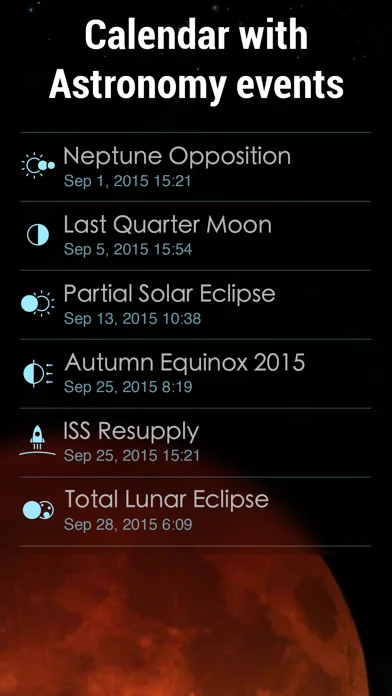
► Astronomy calendar of Solar Walk 2 includes various astronomical events and events related to space exploration (the launching of satellites, the first landing on the moon, etc). Choose any date and time and travel in time observing the most interesting celestial events of different periods.
► Wonderful panoramic photos of space objects. Fascinated by the beauty of the Solar system, want to capture celestial objects in their glory? You can select any object, make a panoramic photo and share it on Facebook. Share the beauty of our universe with your friends.
► Be aware of the latest news from the world of space and astronomy with Solar Walk 2. The app's "What's new" section will inform you about the most outstanding celestial events in time. You won't miss the latest astronomy news.
Solar Walk 2 is an excellent educational tool perfect for both adults and children who are interested in astronomy and space exploration.
How is it different from Solar Walk? Solar Walk 2 has all-new graphics, interface and updated planetary textures. Your exploration of the Solar system in Solar Walk 2 is guided by a carefully handpicked calendar, a collection of simulations of celestial events with stunning visuals. You can still fly around the Solar system and explore it on your own, like in Solar Walk 1, but now you have a comprehensive tour guide at your disposal.
The app contains In-App Purchases (Premium access).
Premium access allows you to enjoy space missions, satellites, celestial events, asteroids, dwarf planets and comets.
Unlock Premium access to the history of space exploration and man-made spacecraft. Travel with Voyager 1, see how gravity assists helped Cassini get to the outer edges of the Solar system, and explore Hubble as if you were right next to it.
Note: Solar Walk users with the app installed on device get unlimited access at a discount.
Start exploring the Universe with Solar Walk 2!
🆕 What's new · v1.6.7
+ Bug fixes and various app enhancements.
If you enjoy using Solar Walk 2, a review on the App Store would be greatly appreciated. Have problems, questions, or suggestions? Feel free to reach us at support@vitotechnology.com.
Comparable iOS apps
The five apps in News with the closest revenue to Solar Walk 2 - View Planets 3D. Click any to see its detail page.
Each forecast combines App Store rating, ratings count, monetisation model, pricing tier, IAP signals and ad-supported flag.
The base estimate is then multiplied by a per-category scaling factor learned from apps with founder-verified MRR.
Every number on this page comes from public APIs and bumetric's own snapshot history.
Full methodology covers input variables, accuracy bands per category and how we treat apps without comparable anchors.
See also the live data on Solar Walk 2 - View Planets 3D's tracker page for current rating, reviews and snapshot timeline.
Building something similar? Get a free AI audit with $-revenue forecasts for every recommendation.

 Lola Speak: English Practice
 Mein Bauernhof: Wimmelapp
 SchulLV
 Тест профпідготовки Нацполіції
 Driving Theory Test UK Kit