Pacific NW Federal Credit Union’s Mobile App makes it easy for you to bank on the go.
Do your banking right from your Android!
You can manage your accounts, pay bills, find ATMs and more!
Bank with confidence - Pacific NW Federal Credit Union’s Mobile App allows you to manage accounts from your mobile device...anytime, anywhere.
Now it’s easy to do banking 24/7, right from your Android.
It’s fast, secure and free. With Pacific NW Federal Credit Union Mobile, you can:
• Check availa…
Pacific NW Federal Credit Union’s Mobile App makes it easy for you to bank on the go.
Do your banking right from your Android!
You can manage your accounts, pay bills, find ATMs and more!
Bank with confidence - Pacific NW Federal Credit Union’s Mobile App allows you to manage accounts from your mobile device...anytime, anywhere.
Now it’s easy to do banking 24/7, right from your Android.
It’s fast, secure and free. With Pacific NW Federal Credit Union Mobile, you can:
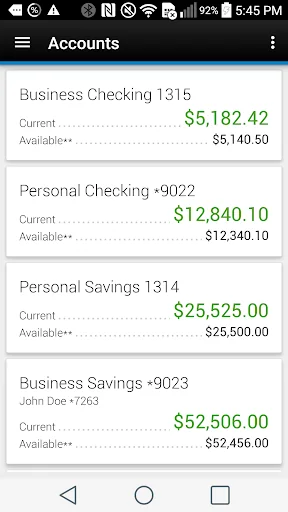
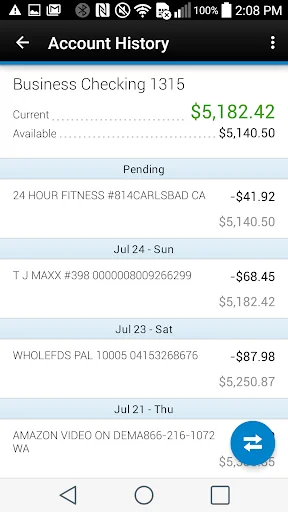
• Check available balances & transaction history
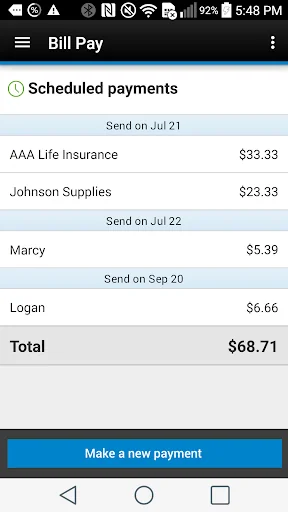
• Pay bills and credit cards
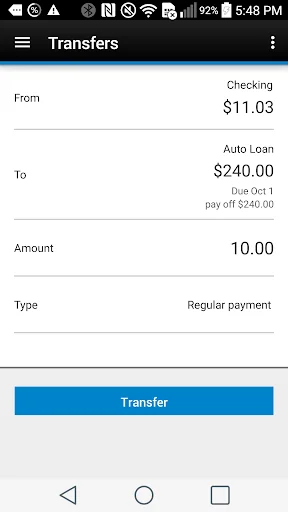
• Transfer money between PNWFCU accounts
• Deposit checks (Android Phone Only)
• Find the nearest PNWFCU branches and ATMs
• Send us a message
To use PNWFCU Mobile, you must be a Pacific Northwest Federal Credit Union member and enrolled in our online banking service. To sign up, www.pnwfcu.org
With this update, the app will ask for permissions to your contacts. Though not enabled at this time, these permissions allow us to experiment with a new feature to allow easier transfer of money to contacts on your phone
Comparable Android apps
The five apps in Finance with the closest revenue to PNWFCU. Click any to see its detail page.
Each forecast combines App Store rating, ratings count, monetisation model, pricing tier, IAP signals and ad-supported flag.
The base estimate is then multiplied by a per-category scaling factor learned from apps with founder-verified MRR.
Every number on this page comes from public APIs and bumetric's own snapshot history.
Full methodology covers input variables, accuracy bands per category and how we treat apps without comparable anchors.
See also the live data on PNWFCU's tracker page for current rating, reviews and snapshot timeline.
Building something similar? Get a free AI audit with $-revenue forecasts for every recommendation.

 Capital Mobile+
 APPLI SGA
 Debtors - Debt Management
 North Shore Bank Personal
 King Price