ML revenue forecast.
Calibrated against 48160 apps in this category.
Confidence band
±15%
High — many comparable apps with verified data
At a glance
Earns 1.89× more than the category median (130/mo).
Ranks #6,807 of 48,160 in Business (top 14.1% by revenue).
Launched May 06, 2026 · last updated Aug 28, 2025.
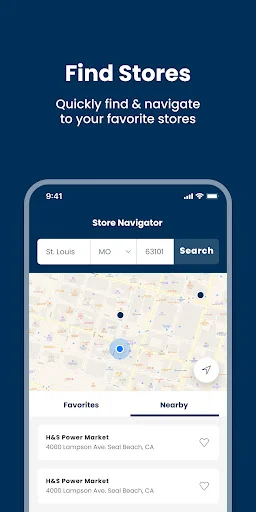
What the app looks like
Live screenshots from the Play Store, captured by our snapshot worker. Tap any image to enlarge.
Power Market's revenue trajectory
Forecast revenue from snapshot history. Last 1 months.
Where Power Market sits in Business
Revenue distribution of 48160 comparable apps. Power Market highlighted.
Power Market vs comparable apps
Revenue trajectory side-by-side. Bold = Power Market, ghosted = peers.
App spec
Version
42.02.06
Last update
Aug 28, 2025
Launched
May 06, 2026
Price
Free
Monetization
Free
What Power Market actually does (from store listing)
Save money at H&S Power Market stores with great coupons on gas, snacks, and more! Simply tap the orange redeem button and show your phone at purchase to redeem your coupons.
Special, limited time, offers are only accessible via this easy to use app powered by RoverTown. Find nearby stores and get notified of nearby coupons.
The H&S Power Market app uses GPS and beacons to find nearby coupons. Continued use of GPS running in the background can dramatically decrease battery life. Easily set…
Save money at H&S Power Market stores with great coupons on gas, snacks, and more! Simply tap the orange redeem button and show your phone at purchase to redeem your coupons.
Special, limited time, offers are only accessible via this easy to use app powered by RoverTown. Find nearby stores and get notified of nearby coupons.
The H&S Power Market app uses GPS and beacons to find nearby coupons. Continued use of GPS running in the background can dramatically decrease battery life. Easily set coupon reminders and never forget your coupons at home again.
Comparable Android apps
The five apps in Business with the closest revenue to Power Market. Click any to see its detail page.
Each forecast combines App Store rating, ratings count, monetisation model, pricing tier, IAP signals and ad-supported flag.
The base estimate is then multiplied by a per-category scaling factor learned from apps with founder-verified MRR.
Every number on this page comes from public APIs and bumetric's own snapshot history.
Full methodology covers input variables, accuracy bands per category and how we treat apps without comparable anchors.
See also the live data on Power Market's tracker page for current rating, reviews and snapshot timeline.
Building something similar? Get a free AI audit with $-revenue forecasts for every recommendation.


 Badakan
 Swoop Towing
 ADManager Plus
 Ace Retailer Mobile Assistant
 Freelancehunt profile