What Professional Stock Chart actually does (from store listing)
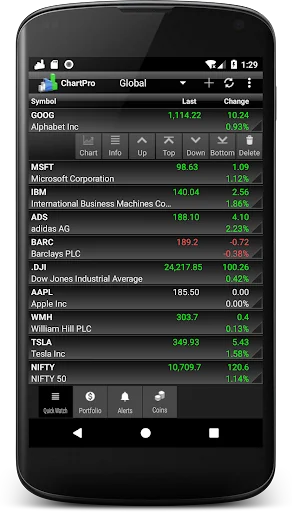
Professional stock chart (ChartPro) is financial application for stocks tracking and technical analysis. Application has integrated professional interactive stock chart that offers various features to help you investing in stocks.
Features of stock chart:
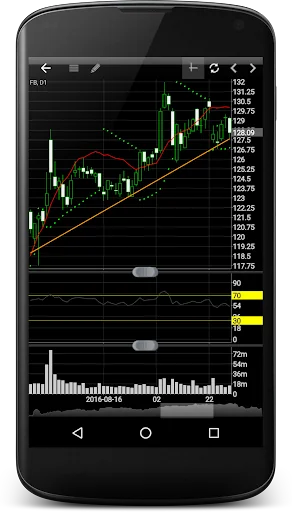
- Scrollable historical stock data
- Zoom in/out option
- Pinch to zoom
- Crosshair cursor
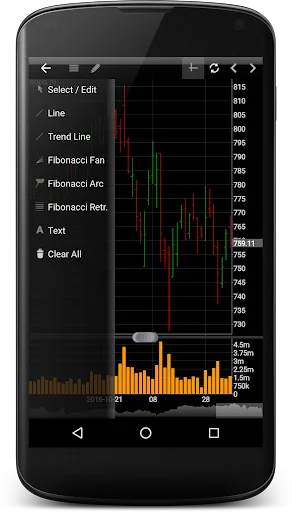
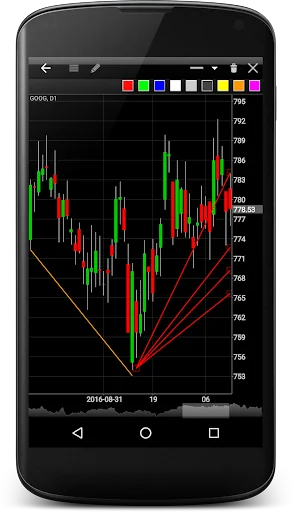
- Drawing tools
- About 50 technical indicators (Moving Averages, MACD, RSI, Parabolic SAR, Stochastic Oscillator, %R, Ichimoku etc)
- Line, Ar…
Professional stock chart (ChartPro) is financial application for stocks tracking and technical analysis. Application has integrated professional interactive stock chart that offers various features to help you investing in stocks.
This application performs optional background data checks to trigger user alerts. You can disable this anytime in Settings.
Application also contains section for stocks portfolio. There you can track your personal finance: current profit/loss depending of purchasing price of underlying financial instrument. Stocks portfolio supports adding new transactions, managing existing transactions, adding dividends and splits. Value of portfolio is automatically calculated as latest quote data is downloaded from server, so you will have your real time personal finance. Opening of both short and long positions is supported by stocks portfolio.
Stock portfolio features:
- Opening both long and short positions
- Adding / Removing transactions
- Adding dividends
- Managing splits
- Opening stock chart directly from portfolio
- Stock details (52 high, 52 low etc)
- Multiple lists
- Symbol drag & drop
- Sorting of symbols
Because of stock chart that has integrated tools for technical analysis, application is suitable for users that want to do detailed research about stock they would like to invest in.
Application has also support for currencies, but because of limitations from free server chart for currency pairs doesn't support candlesticks and OHLC chart types.
Quick watch and stock portfolio screens are separated, so user can track values of stocks independently of stocks portfolio.
Most popular markets are supported like US, Canada, UK, Germany, Australia, India etc.
Comparable Android apps
The five apps in Finance with the closest revenue to Professional Stock Chart. Click any to see its detail page.
Each forecast combines App Store rating, ratings count, monetisation model, pricing tier, IAP signals and ad-supported flag.
The base estimate is then multiplied by a per-category scaling factor learned from apps with founder-verified MRR.
Every number on this page comes from public APIs and bumetric's own snapshot history.
Full methodology covers input variables, accuracy bands per category and how we treat apps without comparable anchors.
See also the live data on Professional Stock Chart's tracker page for current rating, reviews and snapshot timeline.
Building something similar? Get a free AI audit with $-revenue forecasts for every recommendation.

 NoiPlus
 AKUN.biz Online Cash Book
 MoneyControl Expense Tracking
 KlikKami - Pinjaman Daring
 CBK Mobile