What Pumpkin Jack actually does (from store listing)
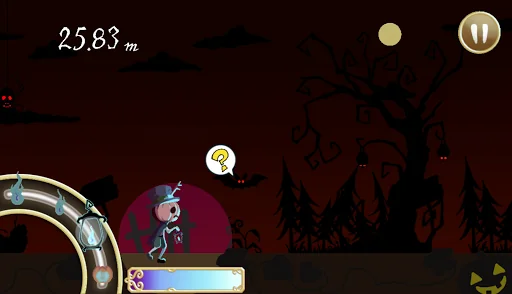
Once upon a night, in a certain place
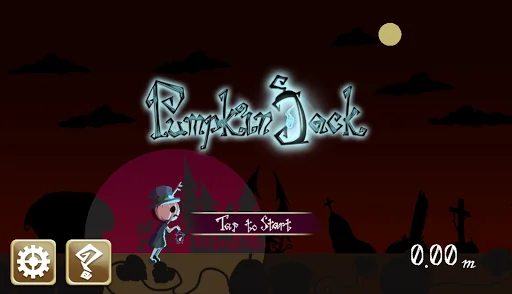
Pumpkin-head Jack with a lantern in his hand
Walking alone down the dark path through the endless night
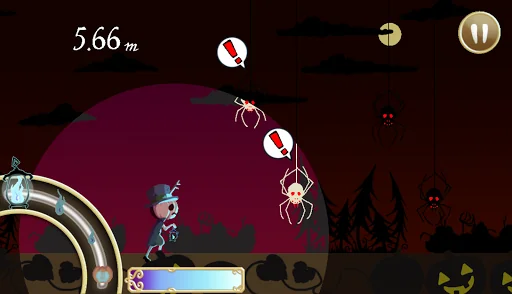
Within the darkness are monsters waiting to ambush
Should the monsters notice the light
They will approach and attack
Control the size of the light
Be careful walking on the dimly lit night path
"[Suggested For]
Android OS 4.0 or higher
[Compatible With]
Android OS 2.3 or higher
If you've found a bug or have other concerns, please con…
Once upon a night, in a certain place
Pumpkin-head Jack with a lantern in his hand
Walking alone down the dark path through the endless night
Within the darkness are monsters waiting to ambush
Should the monsters notice the light
They will approach and attack
Control the size of the light
Be careful walking on the dimly lit night path
"[Suggested For]
Android OS 4.0 or higher
[Compatible With]
Android OS 2.3 or higher
If you've found a bug or have other concerns, please contact our technical support team.
[Technical Support]
support@hit-point.co.jp
We may wish to respond to your inquiry. If you're using an e-mail spam filter, please disable it before you contact us, or add support@hit-point.co.jp to your list of allowed addresses.
"
Comparable Android apps
The five apps in Casual with the closest revenue to Pumpkin Jack. Click any to see its detail page.
Each forecast combines App Store rating, ratings count, monetisation model, pricing tier, IAP signals and ad-supported flag.
The base estimate is then multiplied by a per-category scaling factor learned from apps with founder-verified MRR.
Every number on this page comes from public APIs and bumetric's own snapshot history.
Full methodology covers input variables, accuracy bands per category and how we treat apps without comparable anchors.
See also the live data on Pumpkin Jack's tracker page for current rating, reviews and snapshot timeline.
Building something similar? Get a free AI audit with $-revenue forecasts for every recommendation.
 Happy Chicken - Save Eggs
 My Fan
 Push One Beer! 3D Game
 Yakiniku King
 Alabama Bones