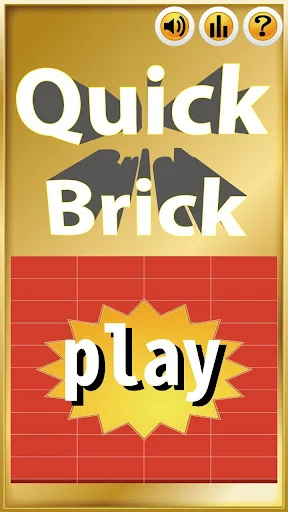
What Quick Brick actually does (from store listing)
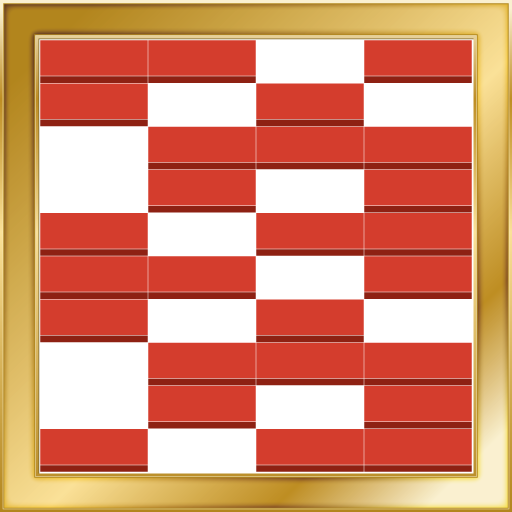
Quick Brick is a funny game to fill bricks.
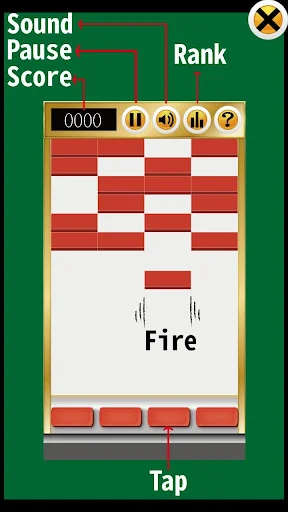
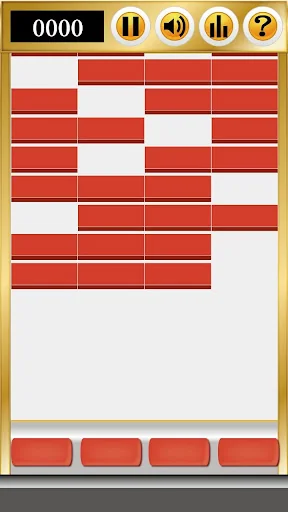
Use buttons in the bottom of the screen to shoot bricks.
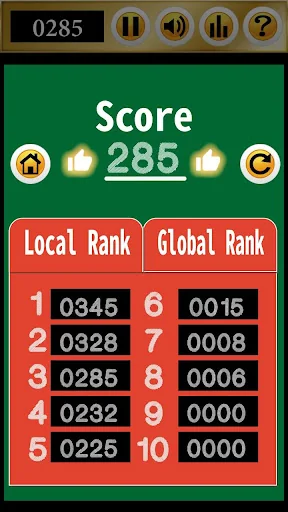
When fill a row, bricks will broken and get score.
The higher score, the higher speed.
Focus and be care of your fingers.
Once you make mistakes, bricks will fulfill the game screen soon.
THEN,,, GAME OVER.
Features:
* Free Game
* Smooth Game Screen.
* Easy to Play
* No need internet connection
* Endless Brick Broken Sound Effect
Facebook : https://www.facebook.com/Just-Play-69…
Quick Brick is a funny game to fill bricks.
Use buttons in the bottom of the screen to shoot bricks.
When fill a row, bricks will broken and get score.
The higher score, the higher speed.
Focus and be care of your fingers.
Once you make mistakes, bricks will fulfill the game screen soon.
THEN,,, GAME OVER.
Features:
* Free Game
* Smooth Game Screen.
* Easy to Play
* No need internet connection
* Endless Brick Broken Sound Effect
Each forecast combines App Store rating, ratings count, monetisation model, pricing tier, IAP signals and ad-supported flag.
The base estimate is then multiplied by a per-category scaling factor learned from apps with founder-verified MRR.
Every number on this page comes from public APIs and bumetric's own snapshot history.
Full methodology covers input variables, accuracy bands per category and how we treat apps without comparable anchors.
See also the live data on Quick Brick's tracker page for current rating, reviews and snapshot timeline.
Building something similar? Get a free AI audit with $-revenue forecasts for every recommendation.
 Ski Ramp Jumping
 Mochi Plush kawaii
 Onet Connect Animal
 Pony Dress Up 2
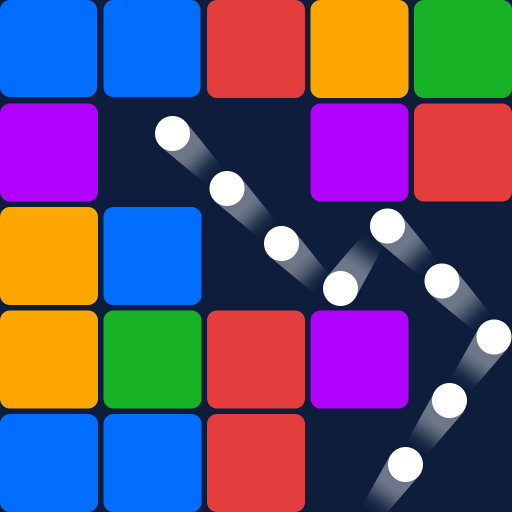 Bricks Ball Puzzle