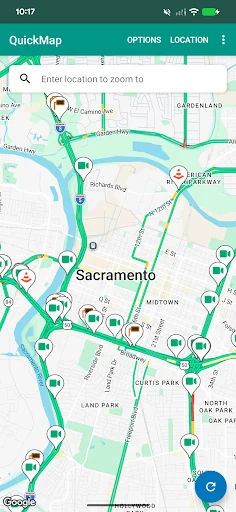
Know Before You Go: QuickMap puts real-time California traffic data straight from Caltrans in the palm of your hand — so you can plan smarter, avoid delays, and drive with confidence.
What's on the map:
- Freeway speeds and congestion
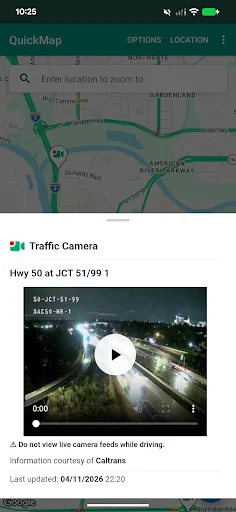
- Live traffic cameras and snapshots
- Lane closures and CHP incidents
- Chain controls and snow plows
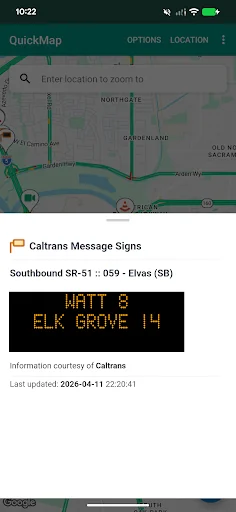
- Changeable message signs
- Border wait times
- Safety roadside rest areas, Park & Ride lots
- Commercial vehicle information including:
-- Weigh sta…
Know Before You Go: QuickMap puts real-time California traffic data straight from Caltrans in the palm of your hand — so you can plan smarter, avoid delays, and drive with confidence.
What's on the map:
- Freeway speeds and congestion
- Live traffic cameras and snapshots
- Lane closures and CHP incidents
- Chain controls and snow plows
- Changeable message signs
- Border wait times
- Safety roadside rest areas, Park & Ride lots
- Commercial vehicle information including:
-- Weigh stations and Escape Ramps
-- Terminal/Service Access Ramps
-- Overweight Corridors and California Truck Networks
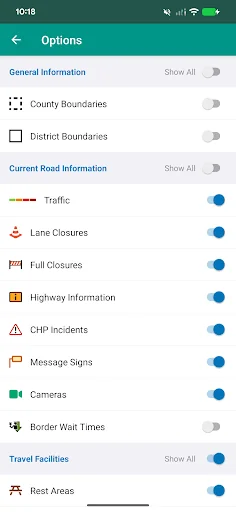
Auto-refresh will refresh data every 3 minutes unless a different refresh interval is selected in the settings screen. Manual refresh is also available via the refresh button at the bottom right of the map.
Enable Geotargeted Notifications to receive alerts about road closures near you — even when the app is closed. Note: If you choose to enable Geotargeted Notifications, this app will monitor your location in the background and alert you (via a Push Notification) to State Highway System road closures occurring near you. Continued use of background location may decrease battery life.
Questions or something not looking right on the map? We want to hear from you — reach us at quickmap@dot.ca.gov.
Comparable Android apps
The five apps in Maps & Navigation with the closest revenue to QuickMap. Click any to see its detail page.
Each forecast combines App Store rating, ratings count, monetisation model, pricing tier, IAP signals and ad-supported flag.
The base estimate is then multiplied by a per-category scaling factor learned from apps with founder-verified MRR.
Every number on this page comes from public APIs and bumetric's own snapshot history.
Full methodology covers input variables, accuracy bands per category and how we treat apps without comparable anchors.
See also the live data on QuickMap's tracker page for current rating, reviews and snapshot timeline.
Building something similar? Get a free AI audit with $-revenue forecasts for every recommendation.

 BRB Mobilidade
 naveo
naveo
 Fleetboard Driver
 Price Coach
 Driver: Driving & Dash Cam App