"I don't wave around non-words like 'unputdownable' often, but Rebuild deserves it." - Touch Arcade (4.5/5)
"Rebuild is a solid, fun, unique and just plain awesome game." - JayIsGames (4.6/5 Best strategy or simulation game)
GAMEPLAY
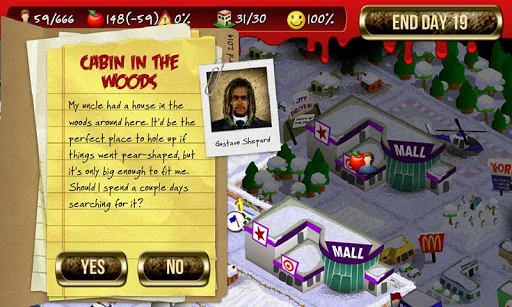
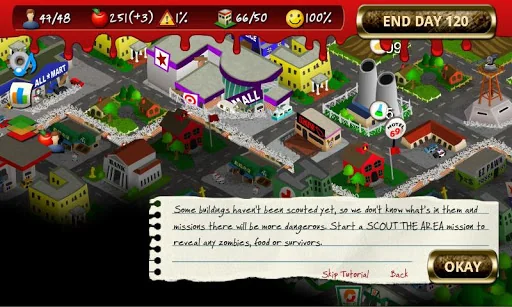
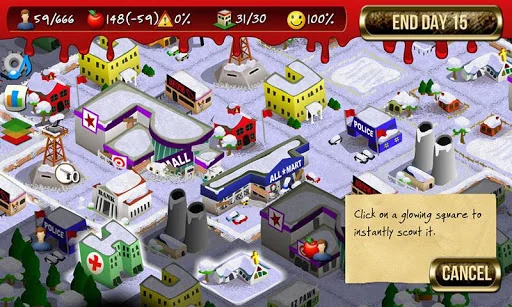
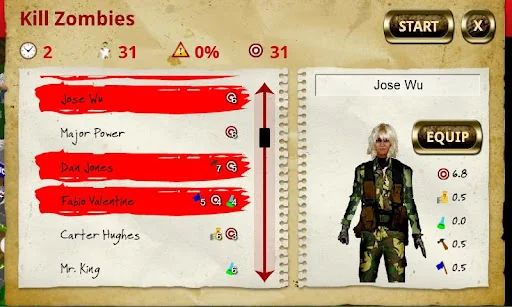
Gather survivors of the zombie apocalypse and defend your fort against undead attacks. Reclaim one building at a time and put your survivors to work scavenging for food, building houses, rediscovering technology and of course killing zombies.
Beware …
"I don't wave around non-words like 'unputdownable' often, but Rebuild deserves it." - Touch Arcade (4.5/5)
"Rebuild is a solid, fun, unique and just plain awesome game." - JayIsGames (4.6/5 Best strategy or simulation game)
GAMEPLAY
Gather survivors of the zombie apocalypse and defend your fort against undead attacks. Reclaim one building at a time and put your survivors to work scavenging for food, building houses, rediscovering technology and of course killing zombies.
Beware of rival gangs, illness, thieves and even riots as you rebuild a city in this post apocalyptic turn based strategy game.
Each forecast combines App Store rating, ratings count, monetisation model, pricing tier, IAP signals and ad-supported flag.
The base estimate is then multiplied by a per-category scaling factor learned from apps with founder-verified MRR.
Every number on this page comes from public APIs and bumetric's own snapshot history.
Full methodology covers input variables, accuracy bands per category and how we treat apps without comparable anchors.
See also the live data on Rebuild's tracker page for current rating, reviews and snapshot timeline.
Building something similar? Get a free AI audit with $-revenue forecasts for every recommendation.

 Age of History II
 Papa's Freezeria To Go!
 Door Kickers
 Clash of Clans
 Escapists 2: Pocket Breakout