RED customer?
Simplify your daily life by downloading the RED & Moi app! 📲
With the RED & Moi app, it's easy, we made it simple ;)
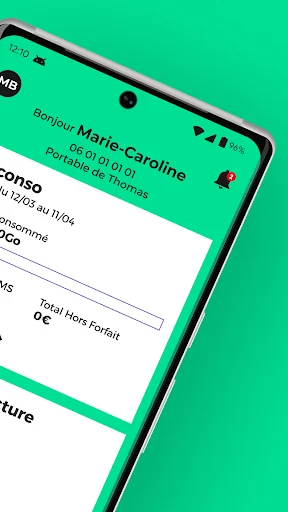
🏠 HOME
• Access your RED subscriptions from your smartphone or tablet!
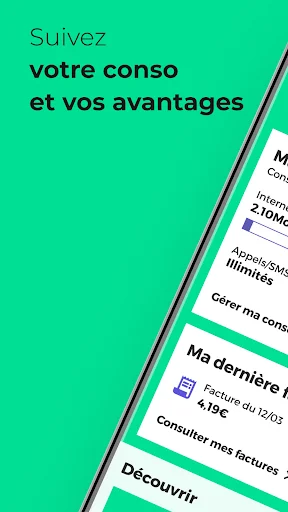
• In just a few clicks, check your usage status and your current RED benefits.
📊 MY USAGE
• View and download the details of your latest bills
• Track your usage in France and abroad:
o In France: view your multimedia purchases with the option to change your purchase limit, view the…
RED customer?
Simplify your daily life by downloading the RED & Moi app! 📲
With the RED & Moi app, it's easy, we made it simple ;)
🏠 HOME
• Access your RED subscriptions from your smartphone or tablet!
• In just a few clicks, check your usage status and your current RED benefits.
📊 MY USAGE
• View and download the details of your latest bills
• Track your usage in France and abroad:
o In France: view your multimedia purchases with the option to change your purchase limit, view the rates applied to and from your mobile line abroad.
o Abroad, with your personalized home screen: track your internet usage, calls, and SMS/MMS messages.
• Want a new phone or more data? Manage and adapt your subscription and your landline and mobile options according to your needs.
📂 MY OFFER
• Access and manage your accounts
• A single account for the whole family? It's possible!
With the RED & Me app, easily consolidate all your lines and those of your loved ones.
📝 MY INFORMATION
• Easily access your personal information
• Change of address? A new bank account details? Directly modify all your personal information in the "My information" section.
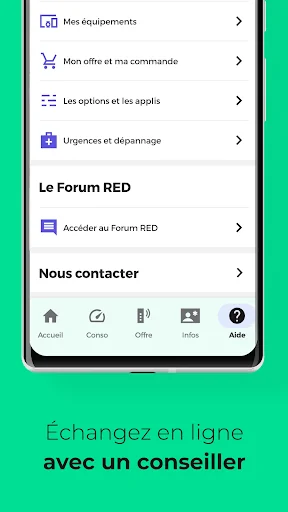
❔ HELP
• Blocked SIM card? The "Troubleshoot my mobile" section provides all the answers you need in case of loss, theft, unlocking, and more.
• Find all the answers to your questions with online help in the FAQ 24/7 and from your RED customer advisors Monday to Friday, 8 a.m. to 9 p.m.
• Already in contact with our customer service? Check your notifications; your RED advisor has probably already answered your question! • Track every step of your mobile and box order: from registration to order preparation, through delivery of your equipment, to activation of your services and line.
RED Box customer?
• A breakdown or incident? The "Troubleshoot my box" section allows you to check the status of your line to assess the network.
• Run the diagnostics to check the status of your box and find the solution to troubleshoot it.
• An issue? You can change your appointment with your box technician directly from your app.
• Access incident tracking directly after reporting it.
🔔NOTIFICATION CENTER
• Stay informed of your RED news via the notification center (new bill, order tracking, etc.)
• It is accessible directly from the top right of your screen. *****
Free download and use in mainland France (excluding mobile internet connection costs depending on the subscription plan). The RED & Moi app is only available to RED by SFR customers with a mobile plan or internet offer.
Comparable Android apps
The five apps in Tools with the closest revenue to RED & Moi. Click any to see its detail page.
Each forecast combines App Store rating, ratings count, monetisation model, pricing tier, IAP signals and ad-supported flag.
The base estimate is then multiplied by a per-category scaling factor learned from apps with founder-verified MRR.
Every number on this page comes from public APIs and bumetric's own snapshot history.
Full methodology covers input variables, accuracy bands per category and how we treat apps without comparable anchors.
See also the live data on RED & Moi's tracker page for current rating, reviews and snapshot timeline.
Building something similar? Get a free AI audit with $-revenue forecasts for every recommendation.


 Clinometer PRO
 7Zipper - File Explorer (zip,
 WiFi Detector: Who Use My WiFi
 Smart Screen On/Off Auto
 simyo
simyo