‘Best Game of 2016 Google Play Indie Games Festival'
The best mobile game you've been waiting for is finally out! ‘Red Bros' is an action puzzle adventure game that you play using gestures. No more auto-play games that leaves you bored - command your troop directly with your own fingers! They will be more than willing to follow your orders. Get into the Tower, rescue the heroes caught by your enemies, and defeat the Skeleton King with them!
Control the troops using gesture
Just draw any sha…
‘Best Game of 2016 Google Play Indie Games Festival'
The best mobile game you've been waiting for is finally out! ‘Red Bros' is an action puzzle adventure game that you play using gestures. No more auto-play games that leaves you bored - command your troop directly with your own fingers! They will be more than willing to follow your orders. Get into the Tower, rescue the heroes caught by your enemies, and defeat the Skeleton King with them!
Control the troops using gesture
Just draw any shape with your finger. Your troop will get into any formation you draw. Come up with your own formation and tactics! You can control more than 20 heroes with a single swipe! Use two fingers to split and send your troops to different places. The victory is (literally) at your fingertip!
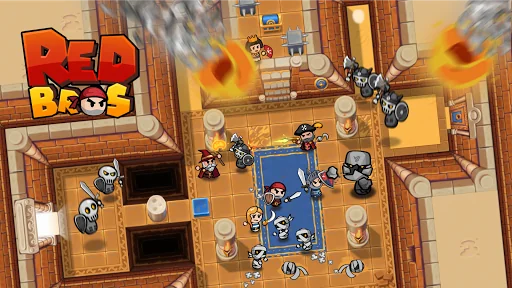
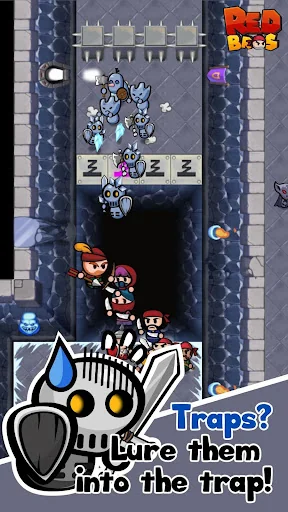
Traps? Lure them into the trap!
Traps are usually just plain annoying... But here, things are different. You can use traps to your own advantage. Avoid the traps and get your enemies get in them instead of you! Well done. That's what I’m talking about!
A variety of puzzles!
The Skeleton King has set up a variety of puzzles in his Tower to stop the heroes. But it's going to be a piece of cake for you, am I right? I’m sure it's nothing for... OOPS! Hurry, the traps will set off if you spend too much time!
Amazing Spells!
Meteors! Arrows! Bombs and Teleportation! Get a variety of Spells and kill your enemies - all at once! Drag and drop your Spells to wherever you want, and they’ll be activated! Yup, just like that! Get 10 monsters at once using Meteor! Very Good! Wait, where are you transporting to!?
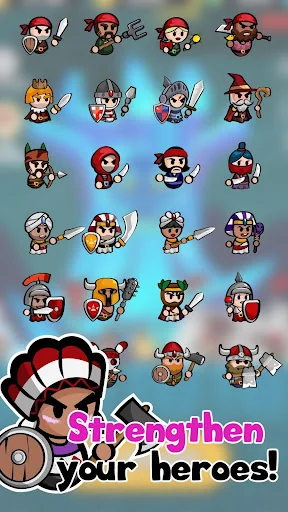
There are so many heroes to choose from!
There are a total of 47 heroes in Red Bros! With different abilities and weapons, they’ll follow your orders. Meet strong, unique heroes and make your best troop! You’ll definitely find heroes that suit your style.
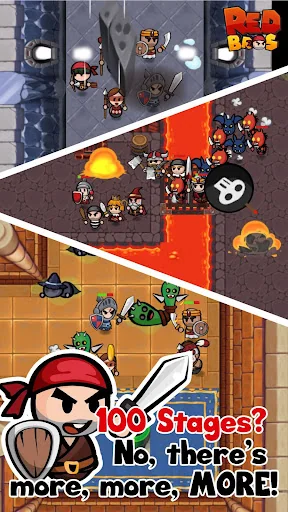
100 Stages? No, there's more, more, MORE!
We’ve prepared more than 100 stages for your entertainment. Complete Missions on your way, and make your troops stronger. We’ll be adding new stages every month, so don't worry and keep playing this game for a long time. We promise we’ll do our best to keep you entertained as long as you want.
Each forecast combines App Store rating, ratings count, monetisation model, pricing tier, IAP signals and ad-supported flag.
The base estimate is then multiplied by a per-category scaling factor learned from apps with founder-verified MRR.
Every number on this page comes from public APIs and bumetric's own snapshot history.
Full methodology covers input variables, accuracy bands per category and how we treat apps without comparable anchors.
See also the live data on Redbros's tracker page for current rating, reviews and snapshot timeline.
Building something similar? Get a free AI audit with $-revenue forecasts for every recommendation.
 Amazing World of Ted
 Lucky Block
 Darkness and Flame 1
 City Coach Bus Simulator 3D
 Escape Bubble